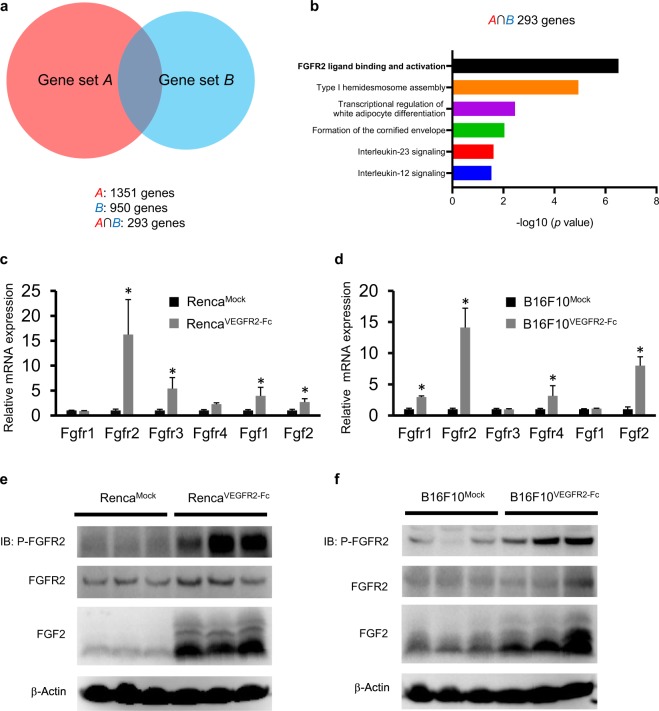
Figure 2.
Pathway analysis in VEGFR2-Fc–expressing tumors compared with Mock tumors based on RNA-Seq analysis. (a) Venn diagram showing genes that are more than 1.5 times upregulated in VEGFR2-Fc–expressing tumors compared with Mock tumors. Gene set A is defined as upregulated in RencaVEGFR2-Fc compared with RencaMock. Gene set B is defined as upregulated in B16F10VEGFR2-Fc compared with B16F10Mock. A ∩ B shows area of intersection of gene set A and gene set B. (b) Reactome analysis of signaling pathways in A ∩ B. The top 6 pathways are shown. (c,d) RT–qPCR analysis of the mRNA levels of various FGF and FGFR family members in Mock and VEGFR2-Fc–expressing tumors. (c) Renca model; (d) B16F10 model. Data are means ± SEM. *p < 0.05 (unpaired t-test). (e,f) Levels of phospho-FGFR2, FGFR2, FGF2 in lysates extracted from Mock and VEGFR2-Fc tumors analyzed by Western Blot analysis. (e) Renca model; (f) B16F10 model.

