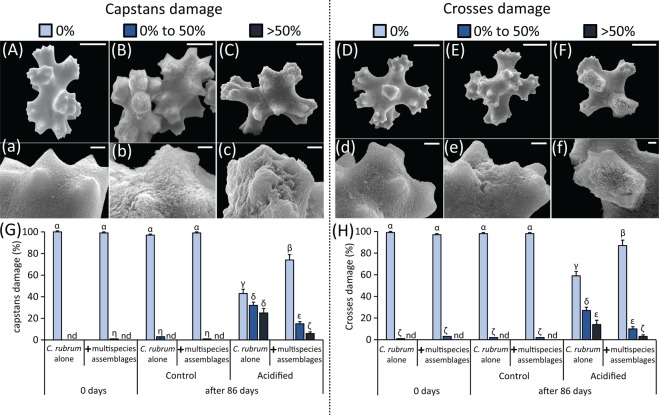
Figure 2.
Impact of acidification on the red coral sclerites. Reported are the Scanning Electron Microscopy images of the red coral’s sclerites, including either capstans (A–C and respective enlarged details a-c) or crosses (D–F and respective enlarged details d-f), and indicative of different levels of damage ranked (A,a and D,d: <0% damage; B,b and E,e: between 0% and 50%; C,c and F,f: >50%). The bar plots show the frequency of the different levels of damage to red coral capstans (G) or crosses (H) for the different experimental systems [i.e., acidified and non-acidified control mesocosms, containing C. rubrum alone or in association with the coralligenous multispecies assemblages, at the start (0 days) and at the end (86 days) of the experiment]. Reported are average values and SDs (n.d., none detected). Greek letters are used to highlight the significant differences (p < 0.01) among the reported values, with α > β > γ > δ > ε > ζ > η in panel (G), and α > β > γ > δ > ε > ζ in panel (H).

