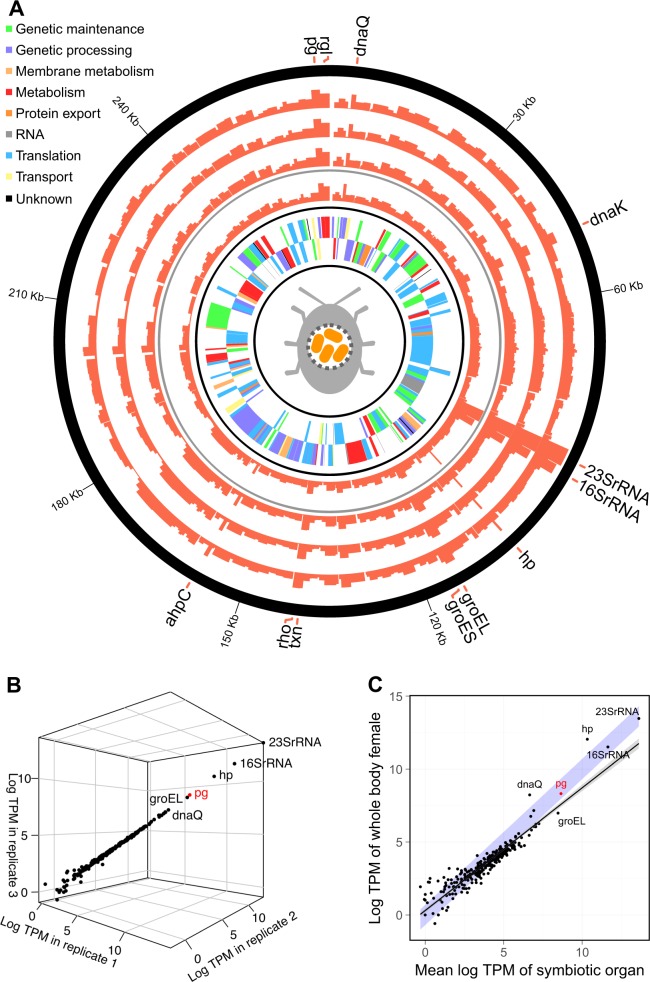
Fig. 1.
Expression profile in transcripts per million (TPM) of the annotated Stammera capleta genome. The inner two layers in (a) represent the identified genes in the forward and reverse direction, the next layer represents the Stammera gene expression profile in the whole body sample of a female Csassida rubiginosa (excluding the gut-associated symbiotic organ, but including the symbiont transmission organs associated with the reproductive tract), and the outer three layers represent the three replicates of Stammera gene expression profiles in the gut-associated symbiotic organs of two male and one female C. rubiginosa, respectively. b Correlation of the relative expression of each Stammera gene for the three replicates of symbiotic organs (mean pairwise Pearson correlation of gene expression profiles between replicate RNAseq data sets: R2 = 0.98; p < 0.001). c Correlation of the mean relative Stammera gene expression in the gut-associated symbiotic organ replicates and the whole body female sample (Pearson correlation, R2 = 0.9; p < 0.001). The line represents a linear regression and the blue area indicates a perfect correlation between both variables. Genes encoding for a hypothetical protein and the polygalacturonase are abbreviated as hp and pg, respectively between both variables. Genes are abbreviated as: hypothetical protein (hp), polygalacturonase (pg), rhmanogalacturonan lyase (rgl), alkyl hydroperoxide reductase C (ahpC), transcription termination factor Rho (rho), and thioredoxine (txn).

