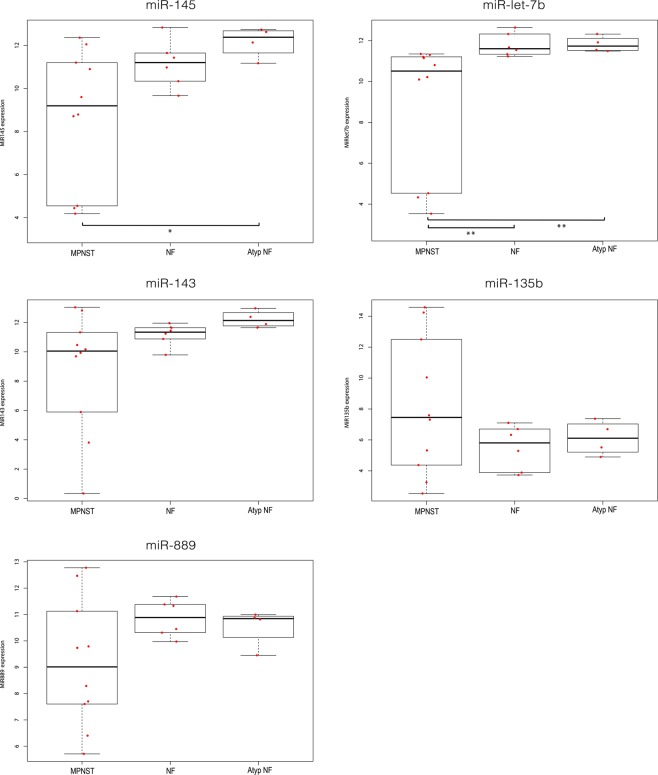
Figure 3.
Expression level of selected microRNAs in unpaired fresh frozen plexiform neurofibroma, atypical neurofibroma and MPNST samples. A quantitative RT-PCR was used to determine miRNA levels of miR-145-5p, let-7b-5p, miR-143-3p, miR135b-5p and miR-889-3p in unpaired fresh frozen NF1-derived MPNST (n = 10), plexiform neurofibroma (NF; n = 6) and atypical neurofibroma (Atyp NF; n = 4). Relative expression is depicted using Box-Whisker plots with boxes showing 1st to 3rd quartile with the median marked by a horizontal line. A Mann Whitney U test was used to determine statistical significance; **p-value < 0.01, *p-value < 0.05.

