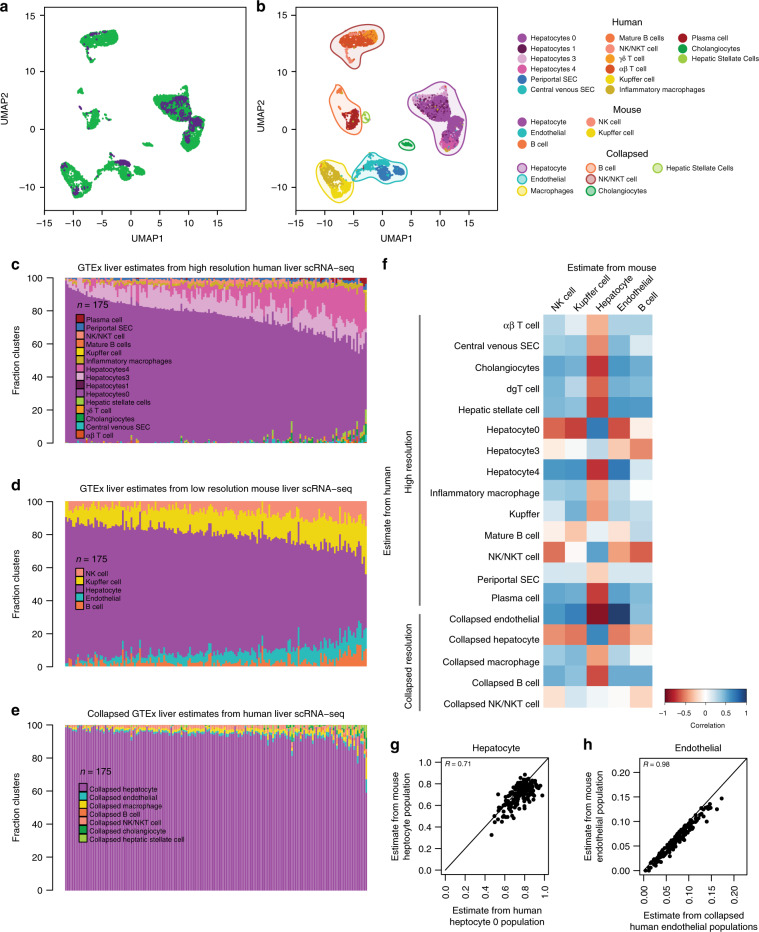
Fig. 2. Comparison of GTEx liver cell estimates using mouse versus human signature gene.
a UMAP plot of integrated scRNA-seq data from human and mouse liver. Each point represents a single cell and color coding of cells indicates the species the cells were obtained from (human = green; mouse = purple). b UMAP plot of integrated scRNA-seq data from human and mouse liver. Each point represents a single cell and color coding of cell type populations are shown in the adjacent legend. The collapsed populations are the same as those shown in Fig. 1f. c–e Bar plots showing the fraction of cell types estimated in the 175 GTEx liver RNA-seq samples deconvoluted using gene expression profiles from high-resolution human liver scRNA-seq c, low-resolution mouse liver scRNA-seq d, and GTEx estimates generated by collapsing high-resolution human cell types within each of the seven distinct cell classes e. f Heatmap showing the correlation of GTEx liver cell population estimates from human liver scRNA-seq at high and collapsed resolutions (rows) and mouse liver (columns) at low resolution. Color coding of heatmap scales from red, indicating negative correlation in estimates, to blue, indicating positive correlation in estimates. Most correlations were significant (p-values are reported in Supplementary Data 2A). g, h Scatter plots of estimated cell compositions across 175 GTEx livers deconvoluted using human scRNA-seq for human hepatocyte 0 population d and human collapsed endothelial cells e versus estimated cell populations deconvoluted using mouse scRNA-seq.

