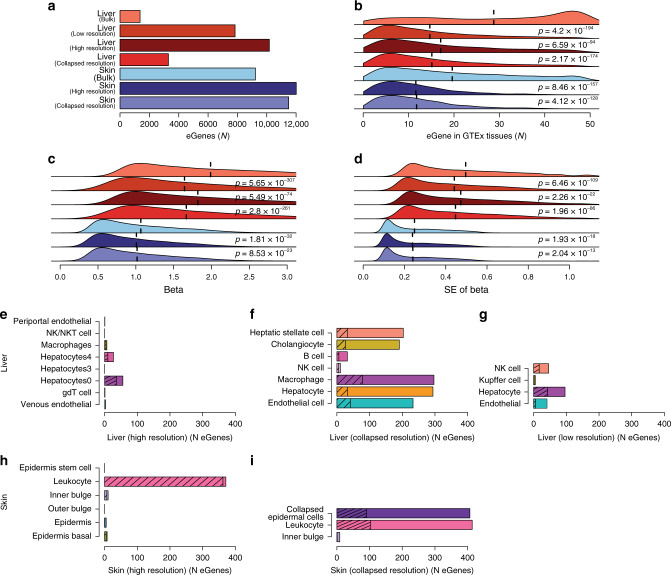
Fig. 5. Using cellular deconvolution to discover cell-type-associated eQTLs.
a Bar plot showing the number of eGenes detected in each eQTL analysis from liver (shades of red) and skin (shades of blue). b–d Distributions of b number of GTEx tissues where each eGene has significant eQTLs, c effect size β, and d standard error of β in liver and skin. Colors are as in panel a. Vertical dashed lines represent mean values. p-values were calculated in comparison with the bulk resolution analysis for each tissue using Mann–Whitney U test. e–i Bar plots showing the number of eGenes significantly associated with each cell population considering cell estimates for: liver high resolution e, liver collapsed resolution f, liver low resolution g, skin high resolution h, and skin collapsed resolution i. Total number of eGenes for each cell type indicates the cell type is significantly associated and the hashed number of eGenes for each cell type indicates the association is cell-type-specific (e.g. only significant in that cell type). In cases where a given cell type had no significant association, the bar is not shown.

