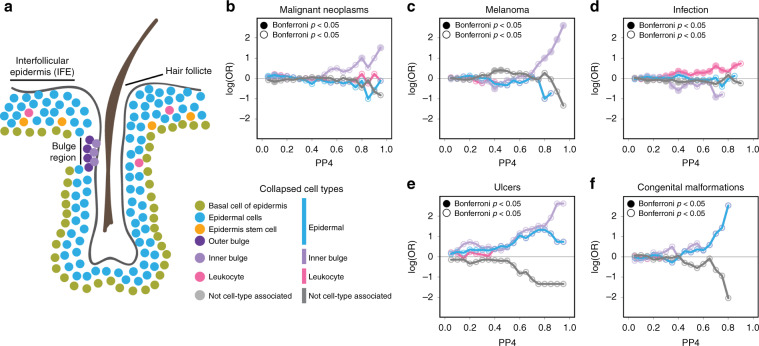
Fig. 6. Colocalization of cell-type-associated skin eQTLs with skin GWAS traits.
a Cartoon describing the approximate organization of cell types identified in scRNA-seq from skin. Colors used for each cell type are used throughout figure and described in the adjacent legend. b–f Line plots showing the enrichment of cell-type-associated eQTLs in various GWAS traits: malignant neoplasms c, melanoma d, infection e, ulcers f, and congenital malformations g. Enrichment is plotted as the log(OR) (y-axis) over all probabilities of the eQTL signal overlapping (0 = not overlapping–1 = completely overlapping) with the GWAS signal (x-axis). Lines are colored following color coding of each cell type from Fig. 5a.

