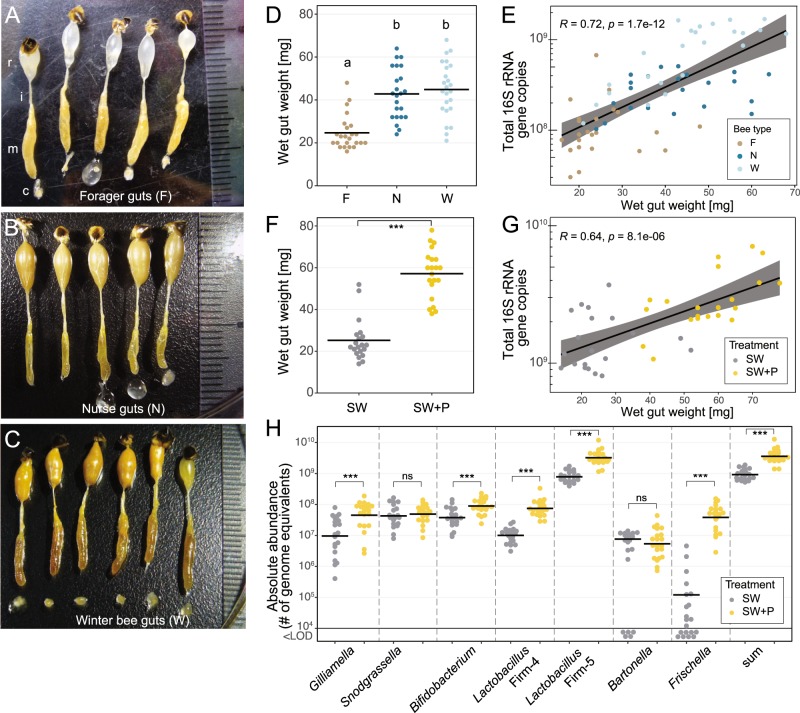
Fig. 3. Diet is a major factor shaping the gut microbiota of honeybees.
a–c Dissected guts of foragers (a), nurses (b), and winter bees (c) consisting of the crop (c) (missing in some samples), the midgut (m), the ileum (i), and the rectum (r) with attached stinger and the last abdominal tergite. d Wet gut weight of individual foragers (F), nurses (N), and winter bees (W). Different letters indicate groups that are significantly different from each other based on ANOVA followed by Tukey’s HSD test (see Supplementary Table S4 for details). e Spearman correlation between gut weight and bacterial loads (assessed with universal bacterial 16S rRNA primers) across all bee types. The gray area indicates the 95% confidence interval. f Wet gut weight of experimentally colonized bees that were fed either sugar water (SW) or sugar water and pollen (SW+P). g Spearman correlation between gut weight and bacterial loads (assessed with universal bacterial 16S rRNA gene primers) across the two treatment groups of colonized bees. h Total abundances of the seven monitored phylotypes in the two treatment groups of colonized bees, as determined by genome equivalents per gut using phylotype-specific qPCR primers. The sum of the abundances of the seven monitored phylotypes is also depicted. Bees with bacterial loads below the limit of detection (<LOD) of the qPCR method are shown below the cut of the axis at 104. Two-group comparisons were done by Permutation T-Test. ns, nonsignificant; ***P < 0.001.

