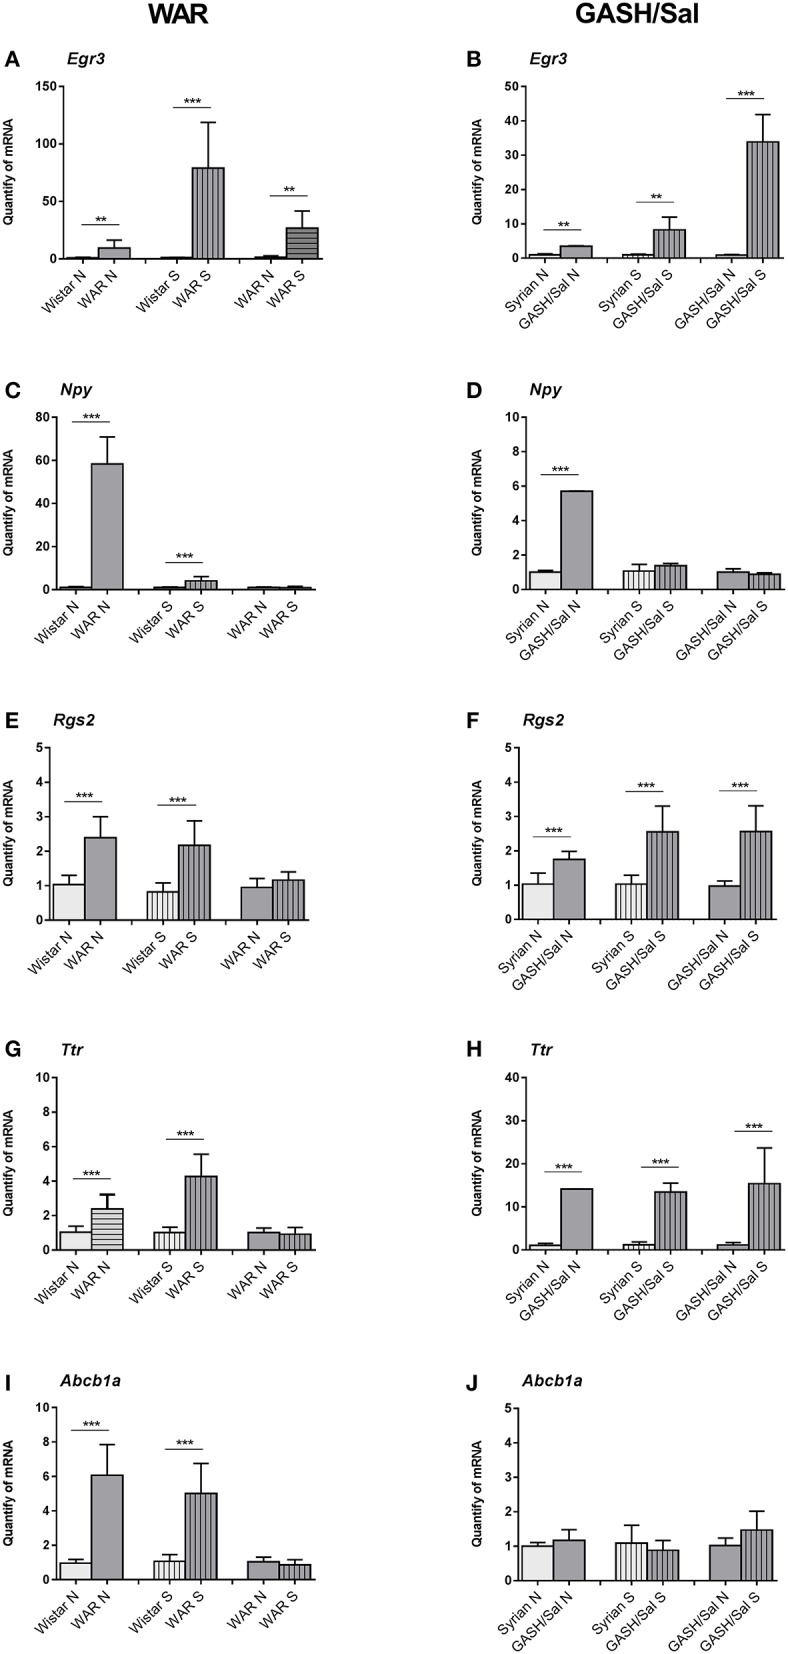
Figure 4.

Relative quantities of transcripts in the inferior colliculus (IC) of the WAR and GASH/Sal models. (Left) WAR Graphics; (Right) GASH/Sal Graphics. In the graphics, X-axis: Relative quantities of mRNA in arbitrary units, Y-axis: Experimental groups: naïve control group (Wistar N; Syrian N); stimulated control group (Wistar S; Syrian S); naïve audiogenic group (WAR N; GASH N); stimulated audiogenic group that presented seizures (WAR S; GASH S). (A,B) Egr3 gene is overexpressed in naïve WAR and GASH/Sal and after seizure. (C,D) Npy gene is overexpressed in both naïve audiogenic groups compared to their respective controls. No statistical difference is observed in the Npy expression between the naïve and stimulated audiogenic groups. (E,F) Rgs2 gene is overexpressed in WAR and GASH/Sal compared to their respective controls, and overexpressed after seizure just in the GASH/Sal model. (G,H) Ttr gene presents overexpression in the naïve and stimulated audiogenic groups in relation to their respective controls, and overexpressed after seizure just in the GASH/Sal model. (I,J) Abcb1a gene is overexpressed in WAR model and no statistical difference was observed in the expression of Abcb1a in the GASH/Sal model. Bars represent mean ± SEM. Statistical analyses: Unpaired t-test. **p ≤ 0.01, or ***p ≤ 0.001.
