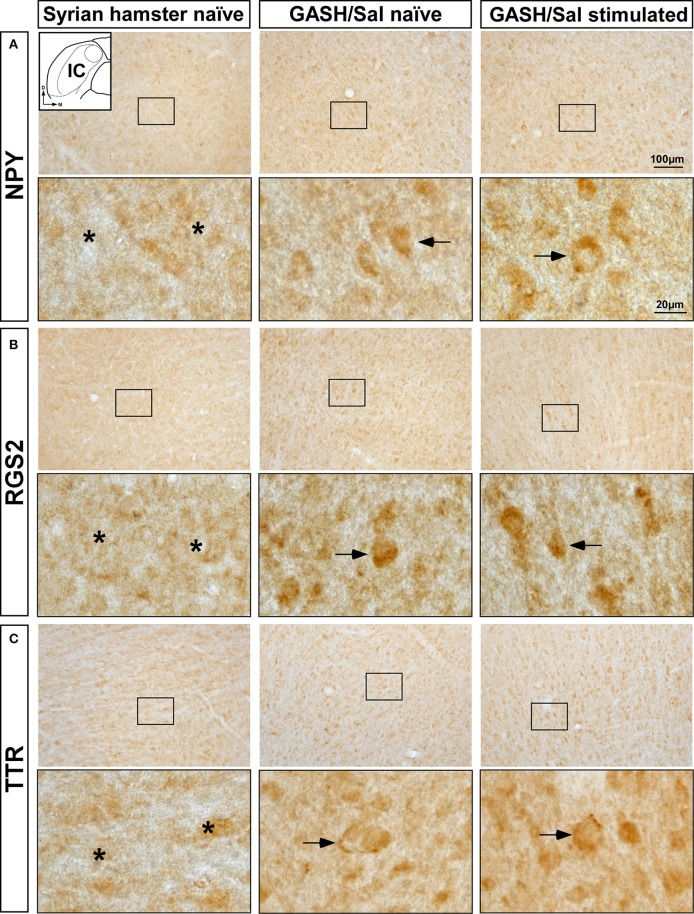
Figure 6.
Immunolabeling of NPY, RGS2, and TTR proteins in the inferior colliculus (IC) of the control Syrian hamster and the GASH/Sal model at naïve and sound-stimulated conditions. The inset in (A) depicts a representative schematic section of the IC (6.00 mm caudal from bregma), in which the immunoreactivity was analyzed. For each protein, upper panels show lower-magnification photomicrographs of the IC and lower panels show higher magnifications corresponding to the frame in the upper panels. (A) Weak NPY-immunopositive perikarya (arrows) are shown in GASH/Sal animals at naïve and sound-stimulated conditions, whereas naïve control Syrian hamster exhibit absence of NPY-immunolabeling (asterisks). (B) Moderate nuclear immunolabeling for RGS2 protein (arrows) is found in GASH/Sal animals at naïve and sound-stimulated conditions. Notice the absence of RGS2-immunolabeling (asterisks) in the control animal. (C) An increase in immunolabeling of TTR (arrows) is shown in GASH/Sal animals at naïve and sound-stimulated conditions when compared to naïve Syrian hamsters (asterisks). Notice the distribution of TTR-immunolabeling outlining the cell bodies of unlabeled IC neurons (arrows). Scale bars for upper panels and lower panels are 100 and 20 μm, respectively.

