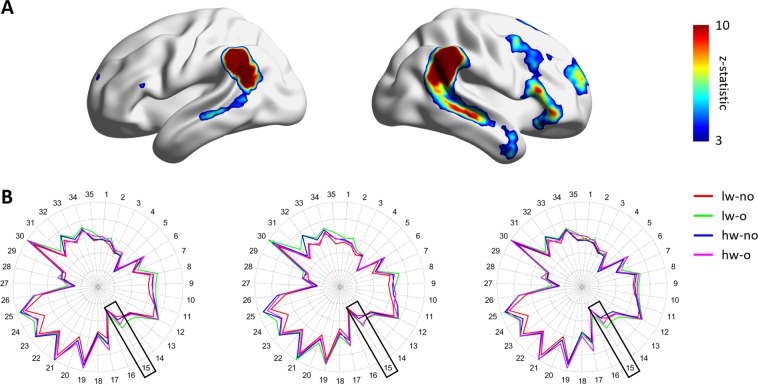
Figure 2.
Between-group comparison at the large-scale network-level. (A) Frontoparietal network (IC #15) mapped onto the brain surface. The color map represents the effect size of the z-statistic values derived from the FSL software. (B) Degree centrality values of all independent components (ICs) in each group. The black boxes represent the frontoparietal network (IC #15). Brain images were visualized using the BrainNet Viewer49. lw, low WMH burden; hw, high WMH burden; o, obese; no, non-obese.

