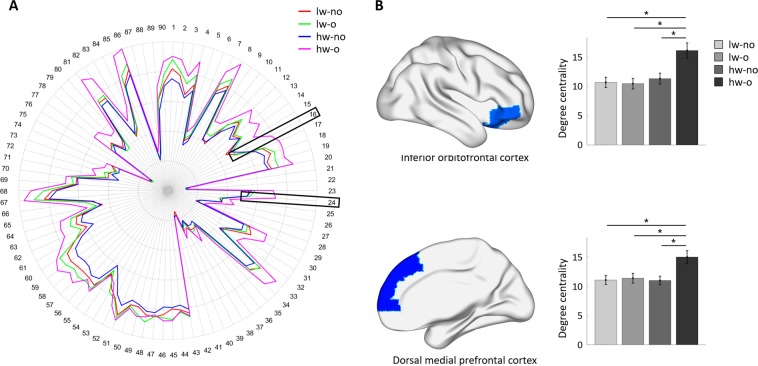
Figure 3.
Between-group comparison at the node-level using the AAL atlas when periventricular white matter hyperintensities (WMHs) were considered. (A) Degree centrality values of all regions in each group. The inferior orbitofrontal cortex (region #16) and the dorsal medial prefrontal cortex (region #24) are represented with black boxes. (B) The three identified regions, with corresponding degree centrality values in all groups. Significant differences are shown with asterisks. Brain images were visualized using the BrainNet Viewer49. lw, low WMH burden; hw, high WMH burden; o, obese; no, non-obese.

