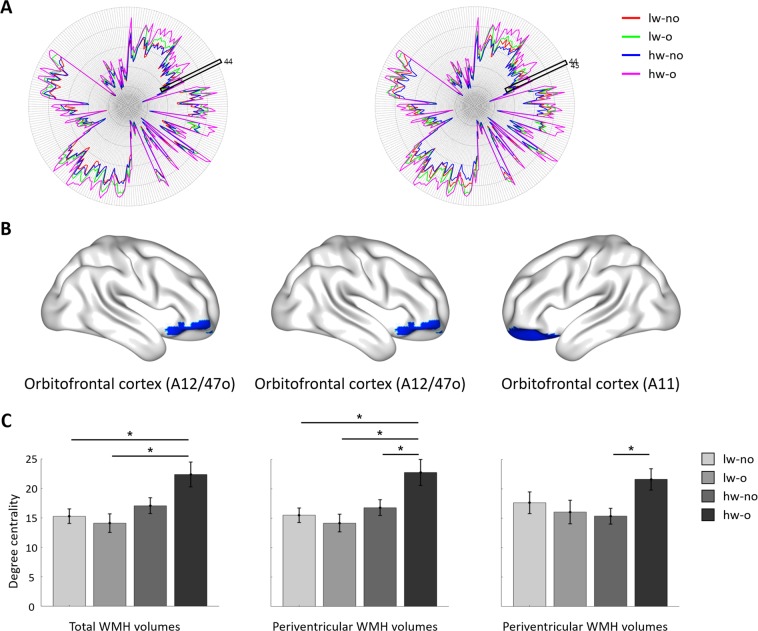
Figure 4.
Between-group comparison at the node-level using the Brainnetome atlas. (A) Degree centrality values of all regions for each group when total (left) and periventricular WMHs (right) were considered. The black boxes represent the orbitofrontal cortex (A12/47o and A11). (B) The identified brain regions when total (left) and periventricular WMHs (middle and right) were considered. (C) Degree centrality values of the identified regions in all groups. Significant differences are shown with asterisks. Brain images were visualized using the BrainNet Viewer49. lw, low WMH burden; hw, high WMH burden; o, obese; no, non-obese.

