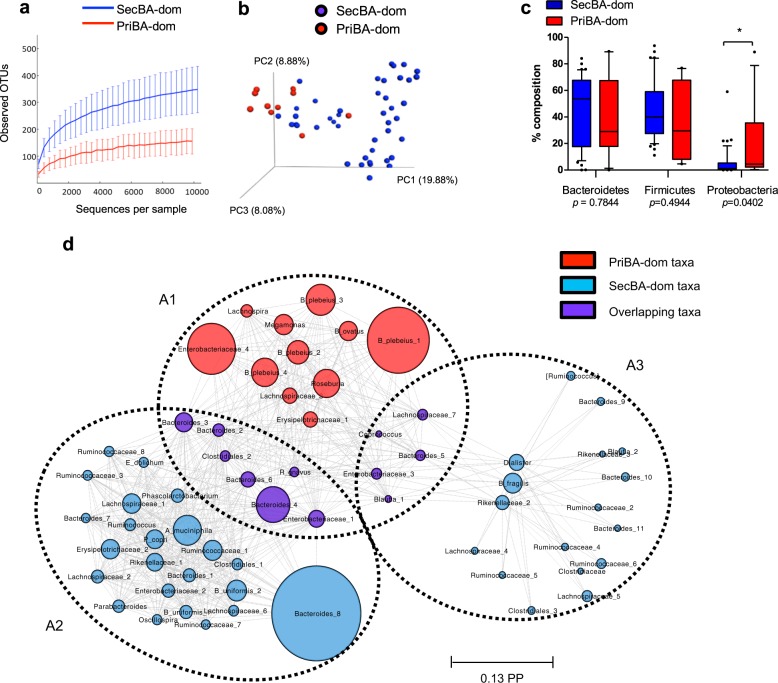
Fig. 2.
a Alpha diversity plots (Chao 1 and Shannon index) and b beta diversity (PCA) plot of OTUs identified in priBA- vs secBA-dominant samples, c Box plots showing relative abundance of taxa in phyla Bacteroidetes, Firmicutes, and Proteobacteria in priBA- and secBA-dominant samples, by non-parametric Mann–Whitney U test (FDR-adjusted), d Community-level association network of the posterior distributions of assemblages and OTUs, identified in the BioMico analysis. Predominate OTUs identified in assemblages are connected by dashed lines. Diameter of circles represents the posterior probability (PP) of the OTU in the assemblage. *p < 0.05, **p < 0.01, ***p < 0.001

