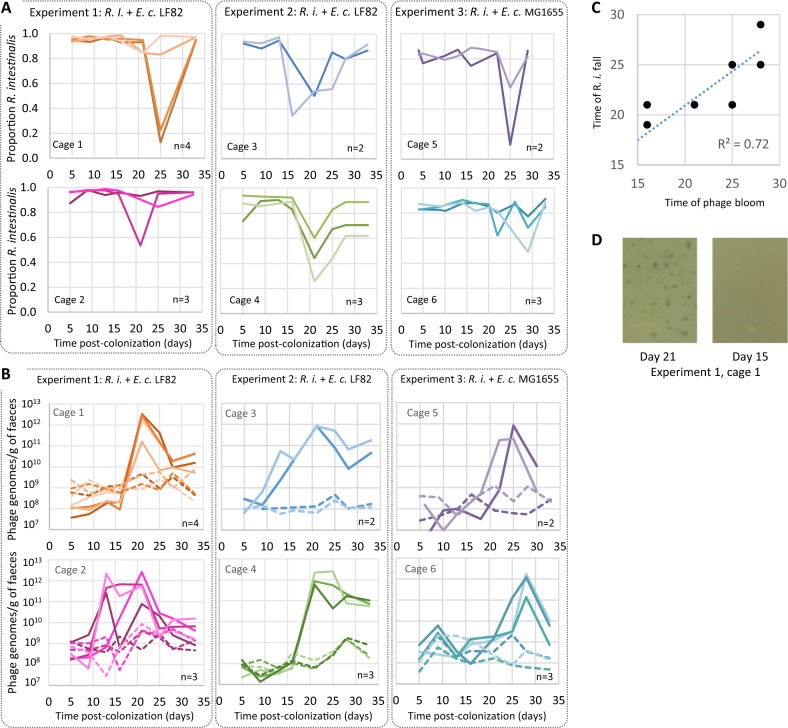
Fig. 2. Variations with time of R. intestinalis and phage populations in mouse faeces.
Each panel corresponds to a different cage, hosting two to four mice (each with a specific shade of colour). In each experiment, two cages (1 & 2, 3 & 4, or 5 &6) were placed in the same isolator. Mice from cages 1–4 were colonised with E.coli LF82, whereas mice in cages 5 and 6 were colonised with E. coli MG1655. a Variation with time of the proportion of R. intestinalis over total bacteria. These proportions were estimated by quantitative PCR in experiments 1 and 2, and by microscopy in experiment 3. b Evolution of the concentration of Shimadzu (solid line) and Jekyll (dashed lines) free phage genomes. c Day of R. intestinalis population collapse as a function of day of Shimadzu bloom. d Lysis plaques on a lawn of R. intestinalis could be obtained from mouse faeces at day 21 (left panel) but not at day 15 (right panel).

