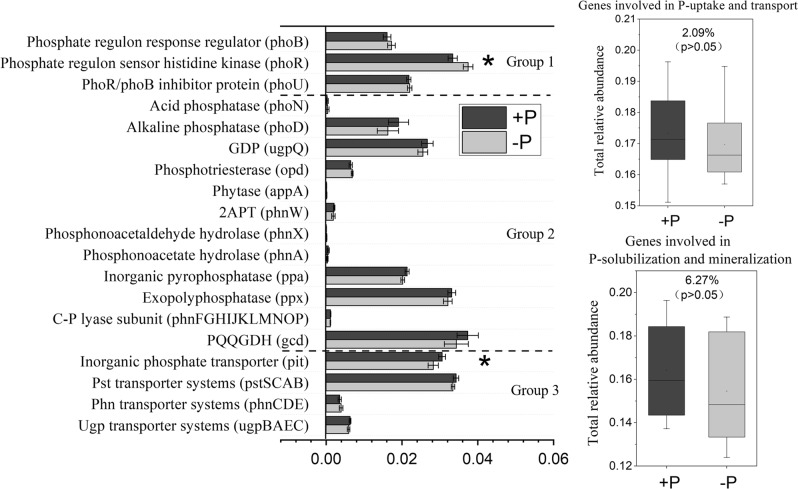
Fig. 2. Relative abundance of representative genes responsible for microbial (1) P-starvation response regulation, (2) inorganic P-solubilization and organic P-mineralization, and (3) P-uptake and transport in soils with and without P input.
The relative abundances of genes were calculated related to the annotated reads. Group 1, Genes coding for P-starvation response regulation; Group 2, Genes coding for inorganic P-solubilization and organic P-mineralization; Group 3, Genes coding for P-uptake and transport. Asterisk represents the significant effects of P input on the relative abundance of genes involved in P-transformation at p < 0.05. The effect of experimental site and the interactions between P input and site are presented in Table S4. 2APT 2-aminoethylphosphonate-pyruvate transaminase, GDP glycerophosphoryl diester phosphodiesterase, PQQGDH quinoprotein glucose dehydrogenase. Error bars are ±standard error. The values on the right boxes (i.e., 2.09 and 6.27%) indicating the shift in relative gene abundance in response to the P input, were calculated using the equation: The relative abundance of ugp transporter systems was calculated as the average abundances of gene ugpB, ugpA, ugpE, and ugpC; the phn transporter systems was calculated as the average abundances of gene phnC, phnE, and phnD; the pst transporter systems was calculated as the average abundances of gene pstB, pstC, pstA, and pstS; the C-P lyase subunit was calculated as the average abundances of gene phnF, phnG, phnH, phnI, phnJ, phnK, phnL, phnM, phnN, phnO, and phnP.

