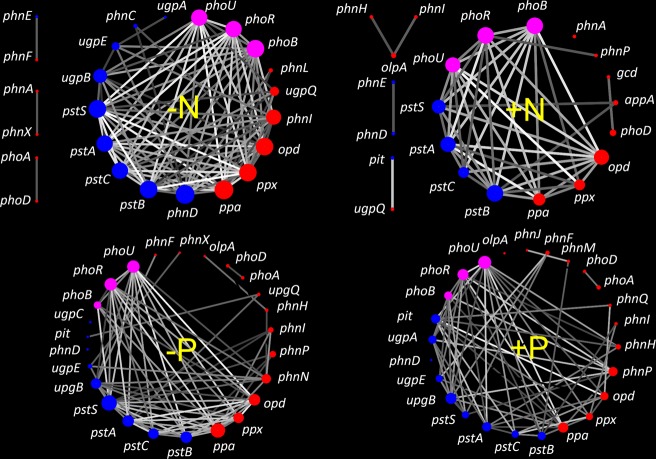
Fig. 4. Occurrence networks of genes involved in P-transformation in soils with and without N or P input.
The node size indicates the strength of the connections with other nodes (genes). Nodes with purple, blue, and red colors represent the genes involved in P-starvation response regulation, P-uptake and transport and inorganic P-solubilization and organic P-mineralization, respectively. The line color indicates the correlation coefficient of association for edges. The basic topological properties and their explanations of the four networks are shown in Table S4.

