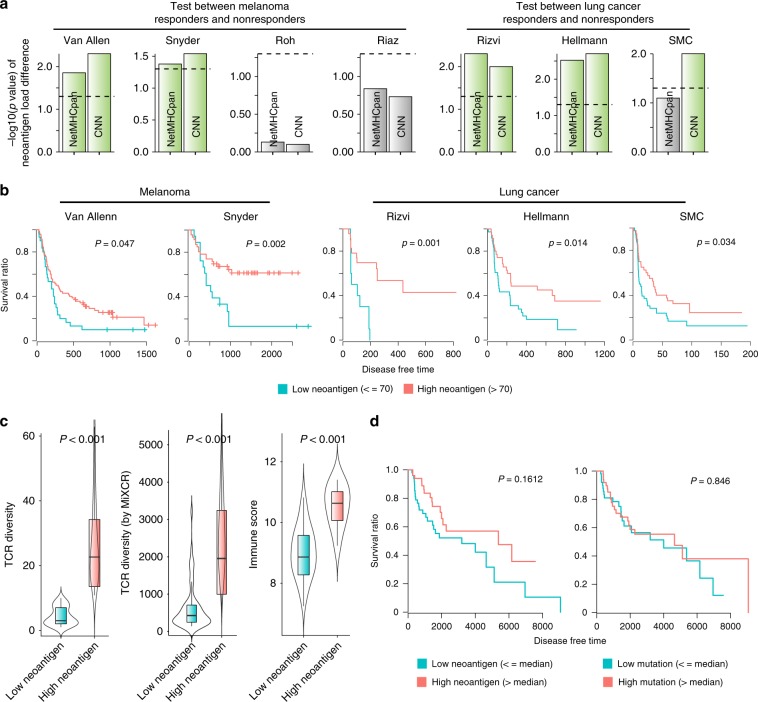
Fig. 2. Clinical relevance of neoantigen load predicted by the CNN model.
a Neoantigen load was estimated by the CNN and NetMHCpan method for four melanoma cohort (Van allen, Snyder, Roh, and Riaz) and three lung cancer cohort (Rizvi, Hellmann, and SMC) samples divided according to the clinical benefit to checkpoint blockade. The Wilcoxon rank-sum test was used to calculate the statistical significance of the difference in neoantigen load between the two groups. -log10(P value) was plotted with the significant cases highlighted in green. b Survival analysis was performed for samples with high versus low neoantigen load in the two melanoma and three lung cancer cohorts that exceeded a given threshold in a. The same threshold of neoantigen load as the previous study9 was used. c, d To test clinical relevance on TCGA melanoma samples (SKCM), we computed TCR diversity and immune score for SKCM and compared them between high-neoantigen (n = 52 for TCR diversity, n = 52 for TCR diversity by MiXCR, and n = 11 for Immune score, respectively) and low-neoantigen groups (n = 51 for TCR diversity, n = 51 for TCR diversity by MiXCR, and n = 10 for Immune score, respectively). The centre line and bottom/upper bounds indicate the median and 1st/3rd quartile, respectively. c Also, survival analysis was performed for samples with high (n = 52) versus low (n = 51) neoantigen load (d). The median level of neoantigen load was used as the threshold to divide the neoantigen groups. Source data are provided as a Source Data file.

