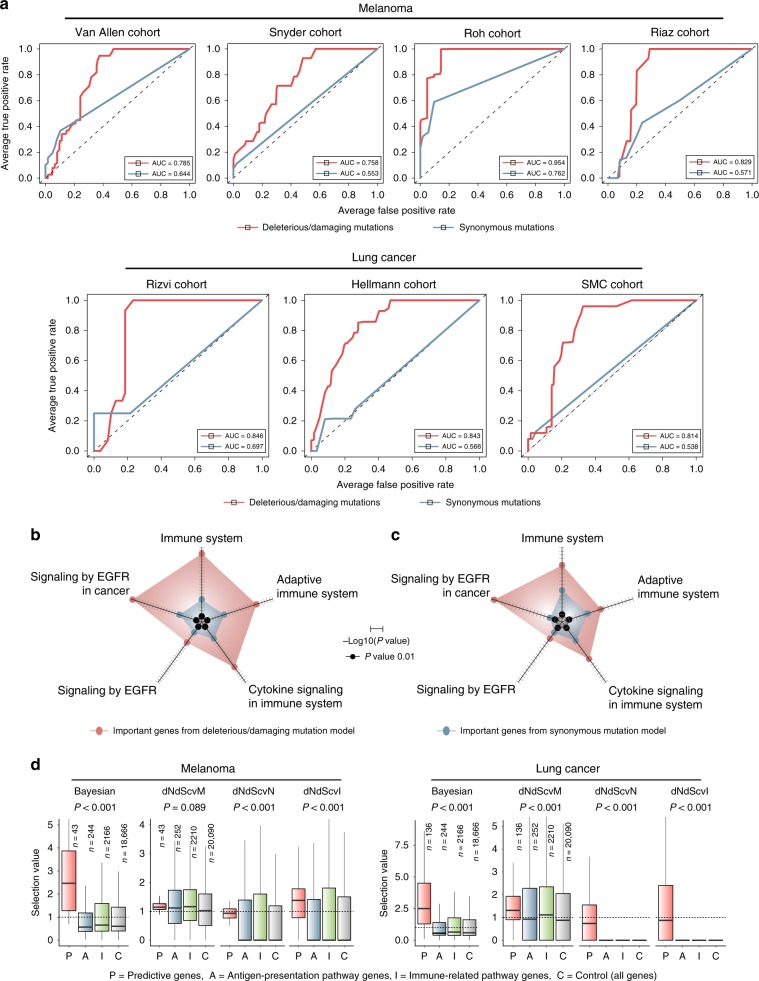
Fig. 3. Exomic prediction of therapeutic resistance.
a We trained random forests using genes that harbour deleterious or damaging mutations in > 5% of the samples. For each cohort, we used the other cohorts of the same tumour type as training data. For example, we trained random forests with Hellman and Rizvi cohorts and tested performance on SMC cohort. Shown here are the ROC curves comparing the original data (red curves) and negative controls generated by training the classifier on synonymous mutations (blue curves). The same number of features and samples were used between the original and negative control model. b, c Functional enrichment of genes with high explanatory power (variable importance > 3) and their interaction partners in b melanoma and c lung cancer. The radar plots present the statistical significance of enrichment. The axis length scales with -log10(P value). d Selection values based on the Bayesian inference32 and covariate model (dNdScv)33 for the genes with high variable importance from our random forest classifier. Shown are the selection values obtained for skin cutaneous melanoma (SKCM) and lung squamous cell carcinoma (LUSC) samples from TCGA. dNdScvM and dNdScvN are the normalised ratio of nonsynonymous to synonymous mutations (dN/dS) for missense and nonsense mutations, respectively. dNdScvI indicates the observed to expected ratio for indels. The centre line and bottom/upper bounds indicate the median and 1st/3rd quartile, respectively. Source data are provided as a Source Data file.

