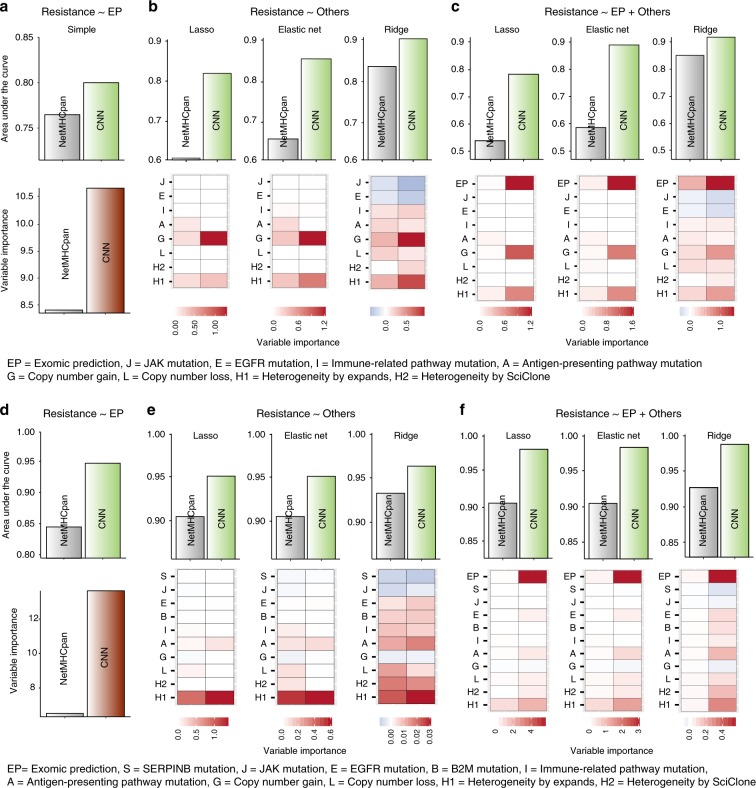
Fig. 4. Comparison of exomic prediction with other resistance markers.
a–c Results for SMC cohort. d–f Results for Roh cohort. a, d AUC (upper) and variable importance (lower) for the regression of therapeutic resistance on the exomic prediction scores when resistance was defined with neoantigen load estimated by CNN or NetMHCpan. b, e AUC (upper) and variable importance (lower) for the regression of therapeutic resistance on the known resistance parameters when resistance was defined based on neoantigen load estimated by CNN or NetMHCpan. c, f AUC (upper) and variable importance (lower) for the regression of resistance on the known resistance parameters and exomic prediction scores when resistance was defined based on neoantigen load estimated by CNN or NetMHCpan. Source data are provided as a Source Data file.

