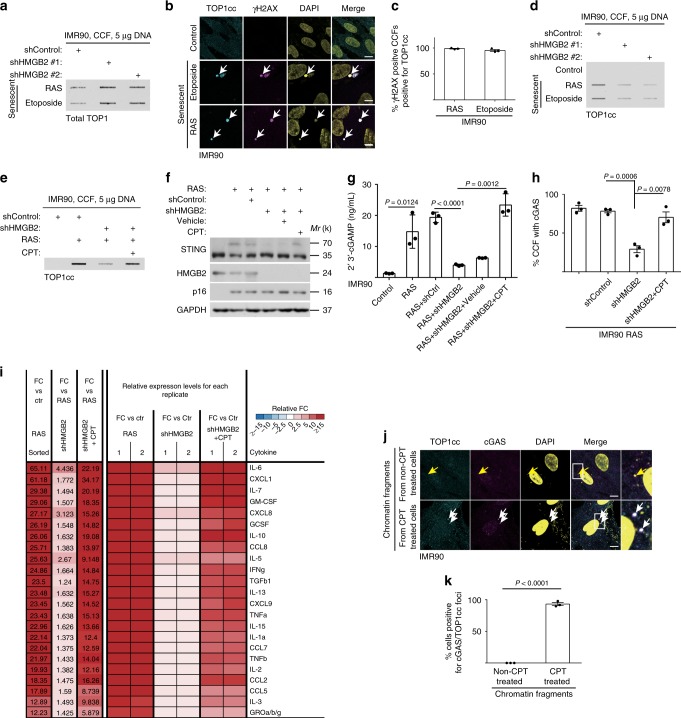
Fig. 2. cGAS activation requires TOP1cc during senescence.
a Slot blot analysis of total TOP1 proteins in CCF purified from senescent IMR90 cells induced by the indicated treatment, with or without HMGB2 knockdown. b, c IMR90 cells induced to senesce by etoposide or oncogenic RAS were stained for TOP1cc and γH2AX (b), and percentages of γH2AX-positive CCF positive for TOP1cc were quantified (c). CCF are indicated by arrows. d Slot blot analysis of TOP1cc levels in CCF purified from senescent IMR90 cells induced by the indicated treatment with or without HMGB2 knockdown. e Slot blot analysis of TOP1cc levels in CCF purified from the indicated IMR90 cells treated with or without TOP1 inhibitor Camptothecin (CPT). f, g Examination of STING dimerization (f) or 2’3’-cGAMP levels (g) in the indicated cells. h Quantification of cGAS localization into CCF in the indicated IMR90 cells. i The secretion of soluble factors under the indicated conditions were detected by antibody arrays. The heatmap indicates the fold change (FC) in comparison with the control (Ctr) or RAS condition. Relative expression levels per replicate and average fold change differences are shown. j, k IMR90 cells were transfected with chromatin fragments isolated from IMR90 cells with or without CPT treatment. Benzonase was used to digest chromatin into fragments. Representative images (j) and quantification (k) of cGAS and TOP1cc co-localization in the transfected IMR90 cells. Arrows point to cGAS foci induced by the transfected chromatin fragments without or with TOP1cc. Data represent mean ± s.e.m. n = 3 biologically independent experiments unless otherwise stated. Scale bar = 10 μm. P-values were calculated using a two-tailed t test. Source data are provided as a Source Data file.

