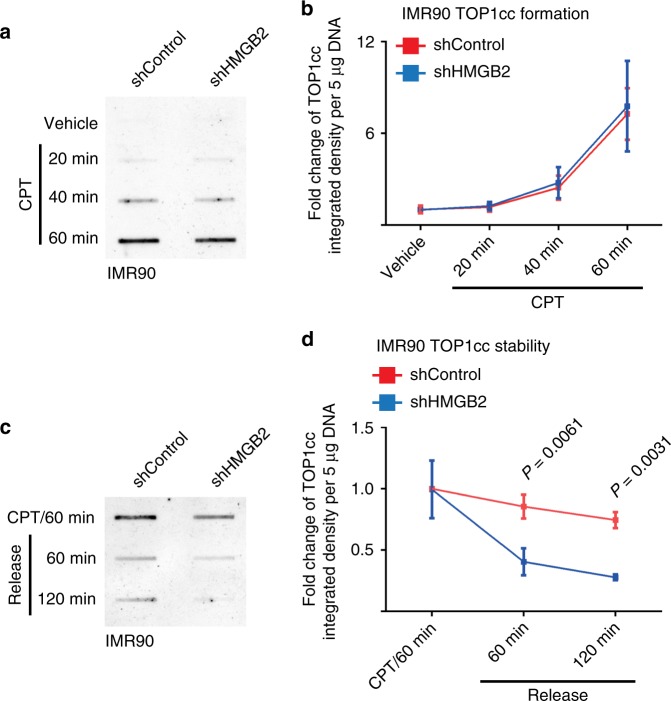
Fig. 3. HMGB2 stabilizes TOP1cc.
a, b IMR90 cells with or without HMGB2 knockdown treated with CPT were analyzed for TOP1cc levels at the indicated time points by slot blot (a). Fold changes in TOP1cc levels at the indicated time points were quantified (n = 3) (b). c, d IMR90 cells with or without HMGB2 knockdown treated with CPT for 60 min and released from the treatment for 60 or 120 min were analyzed for TOP1cc levels by slot blot (c). Fold changes in TOP1cc levels at the indicated release time points were quantified (n = 3) (d). Data represent mean ± s.e.m. n = 3 biologically independent experiments. P-values were calculated using a two-tailed t test. Source data are provided as a Source Data file.

