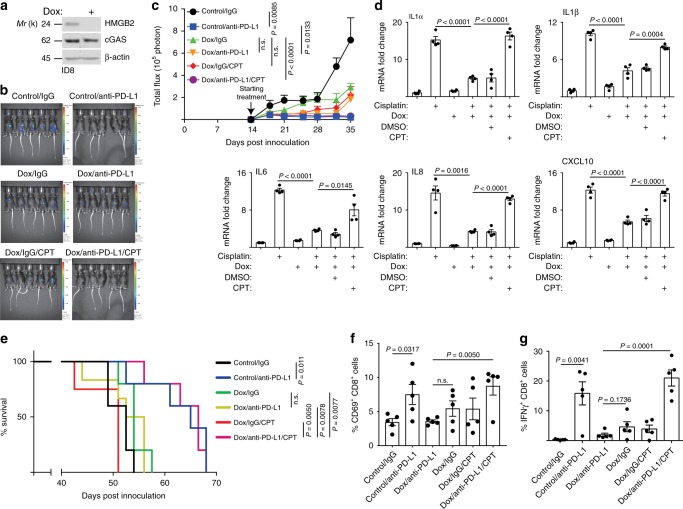
Fig. 5. HMGB2-TOP1cc-cGAS axis determines response to immune checkpoint blockade.
a Mouse ID8-Defb29/Vegf-a ovarian cancer cells expressing doxycycline (DOX) inducible shHMGB2 with or without DOX induction were analyzed for expression of HMGB2, cGAS, and a loading control β-actin by immunoblot. b Representative bioluminescence images of mice in the indicated treatment groups at the end of experiments. c Quantification of tumor growth based on luciferase bioluminescence in the indicated treatment groups at the indicated time points (n = 5 biologically independent mice per group). d Expression of the indicated SASP factors in tumor cells sorted by FACS from ascites formed in mice from the indicated groups determined by qRT-PCR (n = 4 biologically independent mice per group). e After stopping the treatment, the mice from the indicated groups were followed for survival. The figure shows the Kaplan–Meier survival curves (n = 5 biologically independent mice per group). f, g At the end of treatment, percentage of CD69-positive cells in CD8-positive T cells (f) and IFNγ-positive cells in CD8-positive T cells (g) was assessed by flow cytometry in the peritoneal wash collected from mice in the indicated treatment groups (n = 5 biologically independent mice per group). Data represent mean ± s.e.m. P-values were calculated using a two-tailed t test except for 4e by log-rank (Mantel–Cox) test. Source data are provided as a Source Data file.

