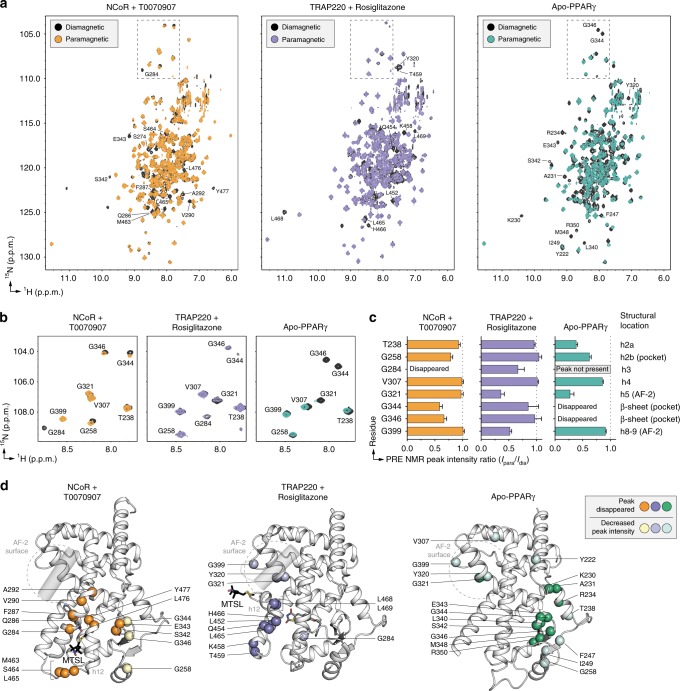
Fig. 7. PRE NMR of the repressive, active, and apo-helix 12 conformations.
a Full 2D [1H,15N]-TROSY-HSQC spectra from the PRE analysis (see manuscript text and methods for sample descriptions). b, c PRE NMR data from (b) a well-dispersed upfield 15N region was used for (c) quantitative peak intensity analysis (error bars calculated using s,d. of data noise levels). d Structural mapping of PRE NMR data to the repressive (NCoR + T0070907; PDB 6ONI), active (TRAP220 + rosiglitazone; PDB 6ONJ), and apo (PDB 1PRG, chain A; helix 12, residues 460–477, is not shown as this conformation is not consistent with the PRE NMR data) conformation PPARγ LBD crystal structures. Source data are provided as a Source Data file.

