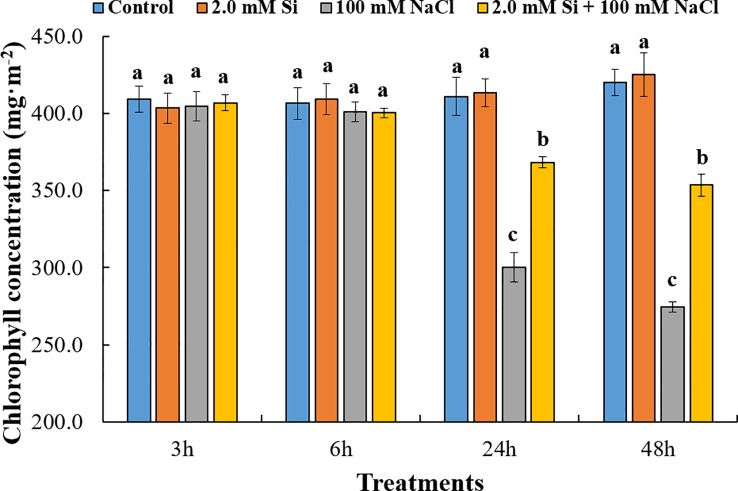
Figure 2.
Influence of chlorophyll concentration after single or combined Si and NaCl treatments in soybean plants. Data were collected at 3, 6, 24, and 48 h after stress exposure. Different letters above error bars indicate significant differences by Duncan's multiple range test (P < 0.05). Data were collected in triplicate and are presented as the average ± standard error (n = 10).

