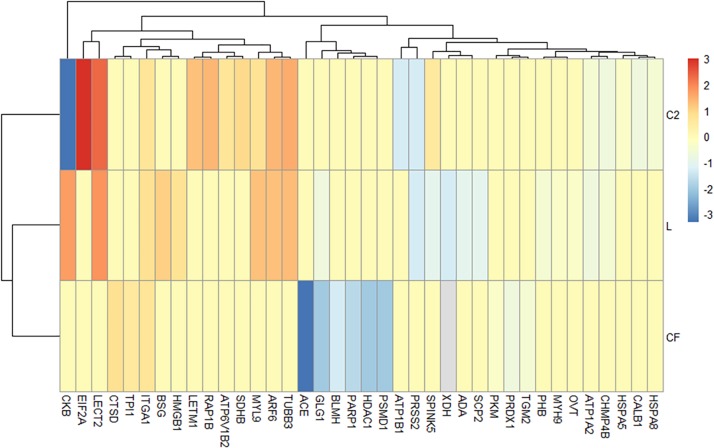
FIGURE 4.
Differentially expressed proteins (DEPs) profiling identified by Ingenuity Pathway Analysis associated with the inflammatory annotation. (A) Heatmap plot represents the log2-fold changes of proteins expressed in ileal samples of broilers treated with lactic acid bacteria mixture (L), Citrobacter freundii (CF), or Citrobacter spp. (C2) in relation to control treatment. Orange shades represent underexpression, while blue shades indicate overexpression of the particular protein. Light gray cells indicate no expression. Hierarchical clustering in the rows is based on the protein composition similarity between treatments, while that in the columns is based on protein abundance.

