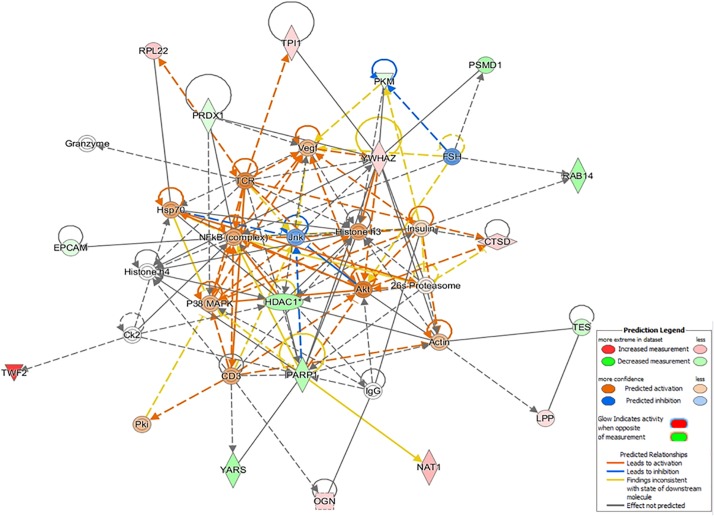
FIGURE 5.
The top-enriched IPA causal network in Citrobacter freundii (CF) relates to cancer, organismal injury, abnormalities, and respiratory disease. The networks are built graphically as nodes (gene/gene products) and edges (the biological relationship between nodes). The red nodes represent the upregulation of proteins in the dataset, while green represents downregulation. The color intensity represents the relative magnitude of change in protein expression.

