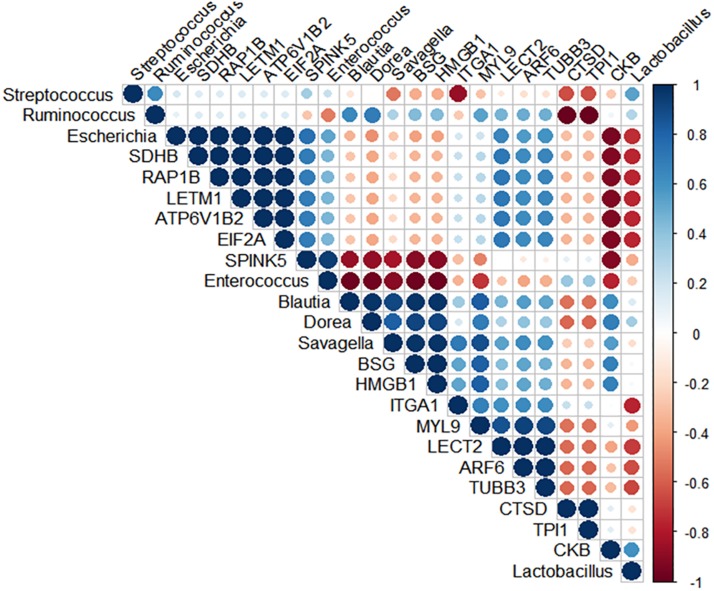
FIGURE 6.
Spearman’s rank correlation matrix of the dominant microbial populations and inflammation-related proteins in the ileum of 10-day-old broilers. Strong correlations are indicated by large circles. The colors of the scale bar denote the nature of the correlation, indicating a perfect positive correlation (dark blue) and –1 indicating perfect negative correlation (dark red). Candidatus Savagella population was positively correlated with MYL9 (R = 0.95, p = 0.051) and ITGA1 (R = 0.95, p = 0.051), as well as Enterococcus abundance had a positive association with SPINK5 (R = 0.95, p = 0.051).

