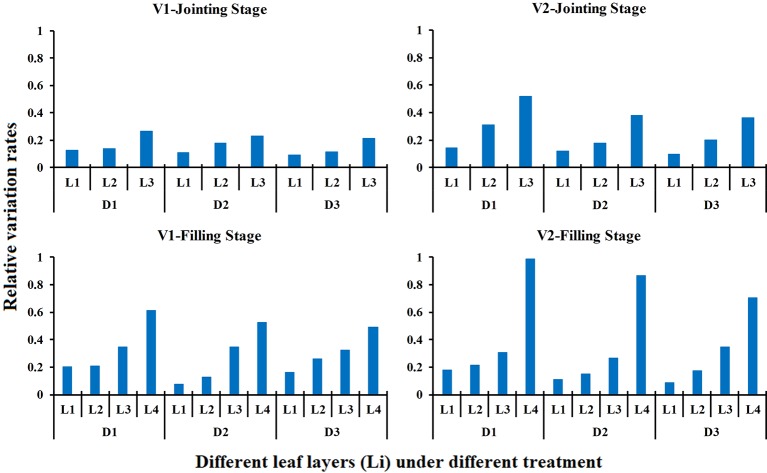
Figure 7.
Relative variation rate of the LNCLi in response to different N rates in different growth stage (2015). The relative variation rate is the product of the nitrogen traits under high nitrogen treatment minus the nitrogen traits under low nitrogen treatment over the nitrogen traits under low nitrogen treatment.

