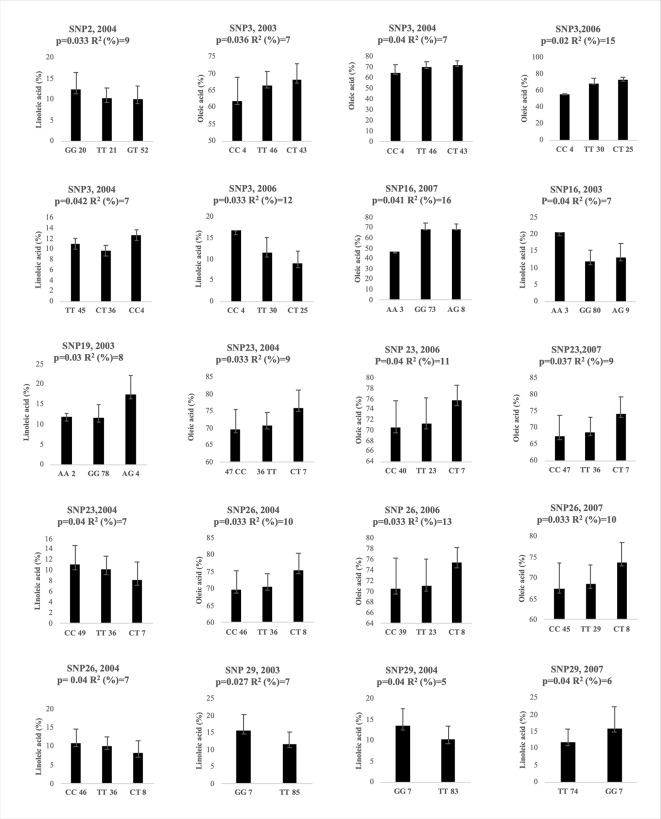
Figure 5.
Genotypic effects of the significantly associated SNPs on oleic and linoleic acid content in different years. The X-axis indicates the genotype status of cultivars (letters) and the absolute frequency of genotypes (number). R2: is the statistical used for association analysis and p is the Benjamini-Hochberg Adjusted p value.

