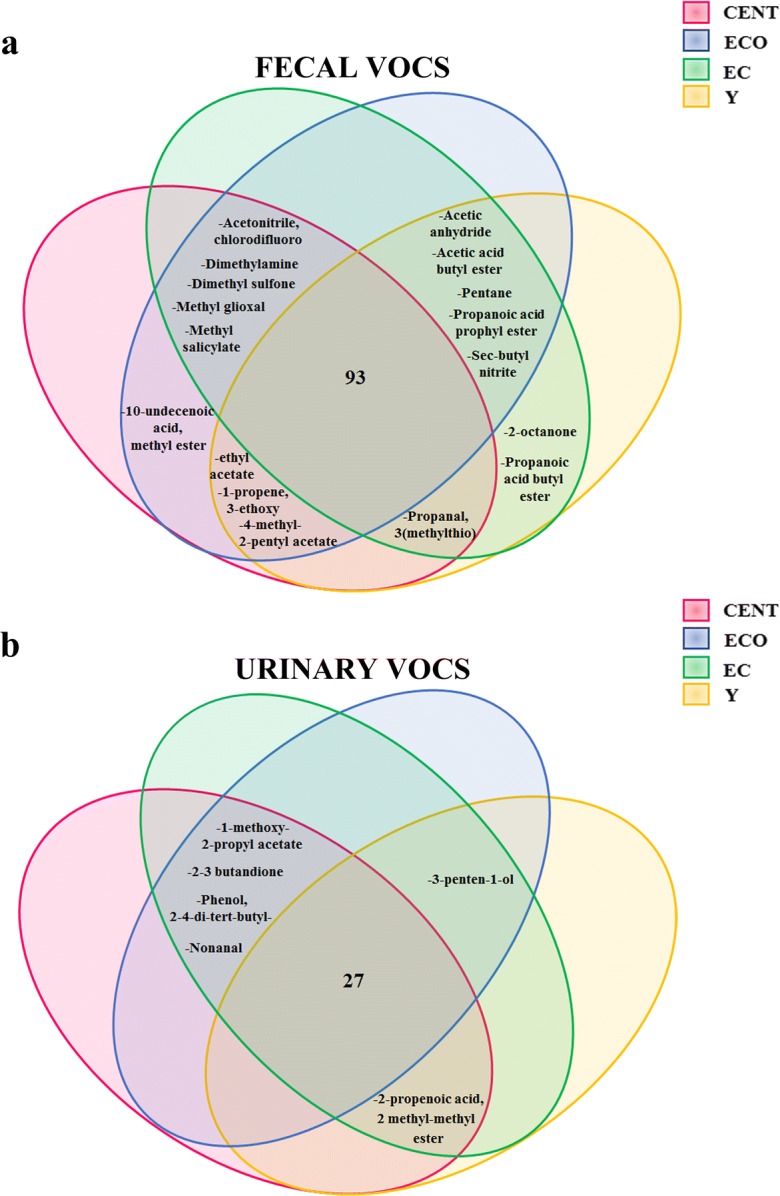
Fig. 2.

Venn diagrams providing a graphical representation of VOCs from feces and urine. a Number and type of VOCs identified in feces of the four age groups: 93 VOCs are expressed in all age group; the VOCs showed in the diagram are those that result differentially detectable in each group. b Number and type of VOCs identified in urine of the four age groups: 27 VOCs are expressed in all age group; the VOCs showed in the diagram are those that result differentially detectable in each group
