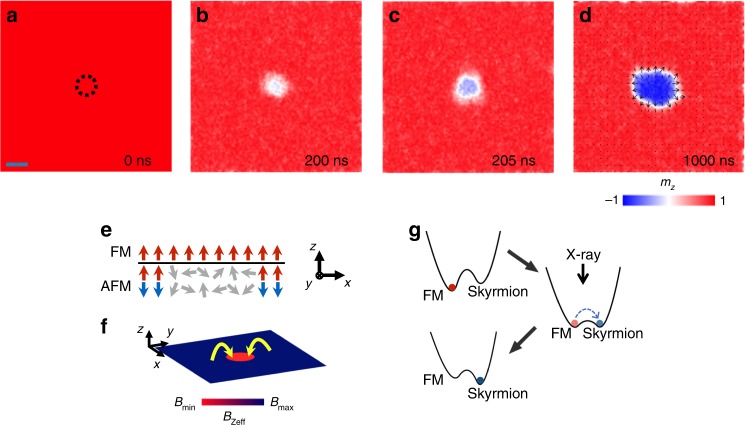
Fig. 4. Simulation of the X-ray-induced single skyrmion creation.
a–d Snapshots of the single skyrmion creation process in the x–y plane. The color represents the averaged mz across all the magnetic layers. The X-ray illumination within the region enclosed by the dashed line is simulated by turning off the perpendicular external field therein. The spin texture of the created skyrmion is also illustrated in d, where the color represents the out-of-plane magnetization and the arrows represent the local magnetization direction. The scale bar in a is 44 nm. e Schematic of the magnetization in both the ferromagnetic and antiferromagnetic layers during the illumination process. f Calculated z-component of the effective field during the illumination (before the skyrmion creation happens). The red circle is the X-ray illumination region. The yellow arrows schematically indicate the influence of the effective field. g The schematic energy landscape of the ferromagnetic state and skyrmion state before, during, and after the X-ray illumination. The energies were calculated via micromagnetic simulations.

