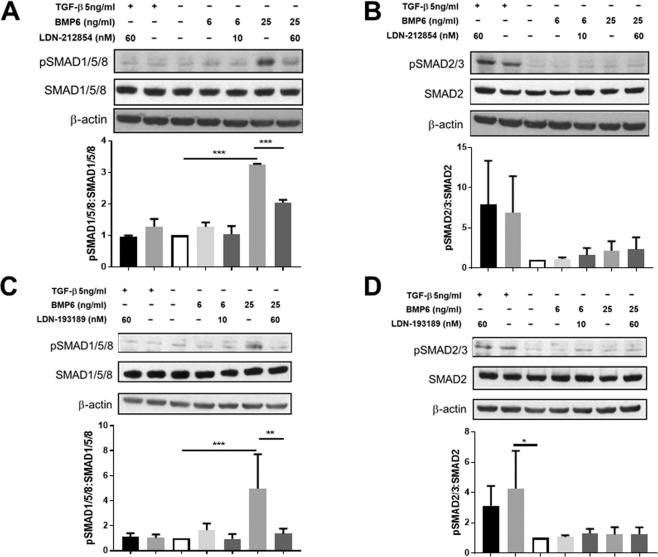
Figure 2.
Effect of ALK2/3 inhibitors on increased phosphorylated SMAD1/5/8 and SMAD2/3 expression induced by BMP6 and TGF-β in HSG cells. Phosphorylated SMAD1/5/8 (pSMAD1/5/8), pSMAD2/3, SMAD1/5/8, SMAD2 and β-actin (internal control) expression in HSG cells subjected to bone morphogenetic protein 6 (BMP6) or transforming growth factor-beta (TGF-β) with/without LDN treatment, as measured by Western blot (WB). To determine expression level, fold change of protein expression relative to control cell lysate (HSG cells treated with culture media and diluent for each BMP signaling inhibitor and diluent for LDN only) was used. (A) Effect of LDN-212854 on pSMAD1/5/8:SMAD1/5/8 ratio. Upper panel: representative WB of pSMAD1/5/8:SMAD1/5/8 ratio after HSG cells were cultured with 5 ng/mL TGF-β + 60 nM LDN-212854 (lane 1), 5 ng/mL TGF-β (lane 2), control medium (lane 3), 6 ng/mL BMP6 (lane 4), 6 ng/mL BMP6 + 10 nM LDN-212854 (lane 5), 25 ng/mL BMP6 (lane 6), or 25 ng/mL BMP6 + 60 nM LDN-212854 (lane 7). Lower panel: 25 ng/mL BMP6 significantly increased pSMAD1/5/8:SMAD1/5/8 ratio (P < 0.0001), but 60 nM LDN-212854 significantly reversed this effect (P < 0.0001); 5 ng/mL TGF-β did not change pSMAD1/5/8:SMAD1/5/8 ratio. (B) Effect of LDN-212854 on pSMAD2/3:SMAD2 ratio. Upper panel: representative WB of pSMAD2/3:SMAD2 ratio after HSG cells were cultured with different reagents as labeled (see legend A). Lower panel: 5 ng/mL TGF-β increased pSMAD2/3:SMAD2 ratio and 60 nM LDN-212854 did not change this effect; BMP6 with/without LDN-212854 did not alter pSMAD2/3:SMAD2 ratio. (C) Effect of LDN-193189 on pSMAD1/5/8:SMAD1/5/8 ratio. Upper panel: representative WB of pSMAD1/5/8:SMAD1/5/8 ratio after HSG cells were cultured with different reagents as labeled (see legend A). Lower panel: 25 ng/mL BMP6 significantly increased pSMAD1/5/8:SMAD1/5/8 ratio (P < 0.0001), but 60 nM LDN-193189 significantly reversed this effect (P = 0.0004); 5 ng/mL TGF-β did not change pSMAD1/5/8:SMAD1/5/8 ratio. (D) Effect of LDN-193189 on pSMAD2/3:SMAD2 ratio. Upper panel: representative WB of pSMAD2/3:SMAD2 ratio after HSG cells were cultured with different reagents as labeled (see legend A). Lower panel: 5 ng/mL TGF-β significantly increased pSMAD2/3:SMAD2 ratio (P = 0.0113), but 60 nM LDN-193189 did not change this effect; BMP6 with/without LDN-212193 did not alter pSMAD2/3:SMAD2 ratio. Data shown are means ± SEM from N = 5 (A&C) or N = 2 experiments (B&D). One-way ANOVA followed by Tukey’s multiple comparison was used to compare the seven groups; *P ≤ 0.05, **P ≤ 0.01 and ***P ≤ 0.0001 when compared with control group.

