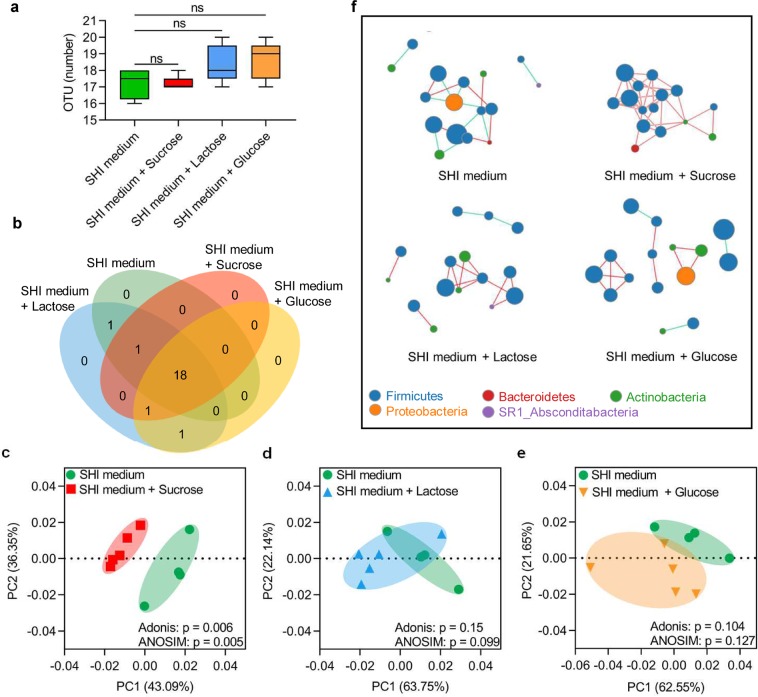
Figure 3.
Sucrose influences the microbial structure and assembly of the oral microecology. (a) The microbial richness as revealed by OTU number. (b) Venn diagram showing shared OTUs among biofilms treated without/with sucrose, lactose and glucose. (c–e) The PCoA and dissimilarity analysis (including Adonis and ANOSIM) of polymicrobial oral biofilm among groups. Each dot stands for a biofilm sample. (f) Network inferences of microbial relationships in biofilms without/with sucrose, lactose or glucose treatment. Each node represents an OTU, and each edge represents a significant pairwise association. Red lines indicate synergistic relationships while green lines represent antagonistic relationships (n ≥ 4; ns, not significant; OTU, operational taxonomic unit; PCoA, principal coordinates analysis).

