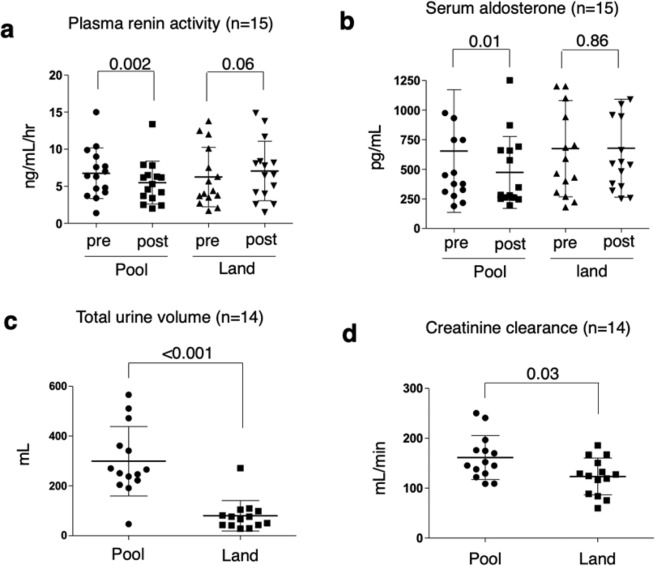
Figure 1.
Renal function parameters during 1-h pool and land walking activities in 15 pregnant women. Differences between plasma renin activity levels and serum aldosterone levels before and after each activity (a,b). Total urine volume and creatinine clearance measured after 1-h pool and land walking activities (c,d). For total urine volume and creatinine clearance, data were available for 14 participants. Statistical analyses were as follows: (a,b) Wilcoxon signed-rank test and (c,d) Wilcoxon rank-sum test. The bars show the means and standard deviations.

