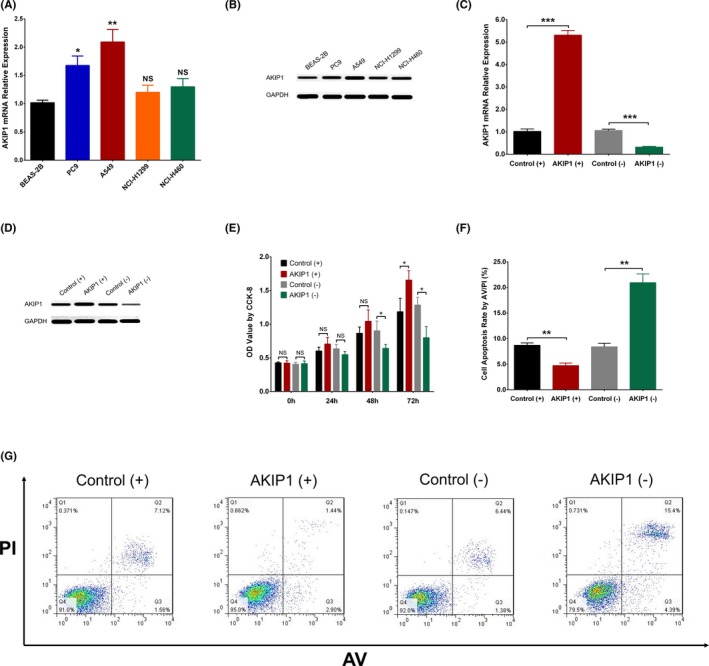
Figure 3.

Effect of AKIP1 on cell proliferation and apoptosis. qPCR assay displayed that AKIP1 mRNA expression was elevated in PC9 cells and A549 cells compared to BEAS‐2B cells, but nondifferentiated in NCI‐H1299 cells and NCI‐H460 cells (A). In A549 cells, Western blot assay showed that AKIP1 expression was higher in PC9 and A549 cells than that in BEAS‐2B cells (B). AKIP1 mRNA expression was elevated in AKIP1 (+) group than that in Control (+) group, while it was lower in AKIP1 (−) group than that in Control (−) group (C). Western blot assay showed that AKIP1 expression was higher in AKIP1 (+) group than that in Control (+) group but reduced in AKIP1 (−) group than that in Control (−) group (D). CCK‐8 assay disclosed that cell proliferation was promoted in AKIP1 (+) group at 72 h (vs Control (+) group) but suppressed in AKIP1 (−) group (vs Control (−) group) at 48 h and 72 h (E). AV/PI assay revealed that cell apoptosis rate was decreased in AKIP1 (+) group (vs Control (+) group) but enhanced in AKIP1 (−) group (vs Control (−) group) (F, G). Comparison between two groups was determined by one‐way ANOVA and t test. P value < .05 was considered significant. *P < .05; **P < .01; ***P < .001. AKIP1, A‐kinase‐interacting protein 1; AV/PI, Annexin V Apoptosis Detection Kit II with propidium iodide; CCK‐8, Cell Counting Kit‐8; qPCR, quantitative polymerase chain reaction
