
. 2019 Dec 27;12(1):3–15. doi: 10.1111/os.12572
© 2019 The Authors. Orthopaedic Surgery published by Chinese Orthopaedic Association and John Wiley & Sons Australia, Ltd.
This is an open access article under the terms of the http://creativecommons.org/licenses/by-nc-nd/4.0/ License, which permits use and distribution in any medium, provided the original work is properly cited, the use is non‐commercial and no modifications or adaptations are made.
Figure 7.
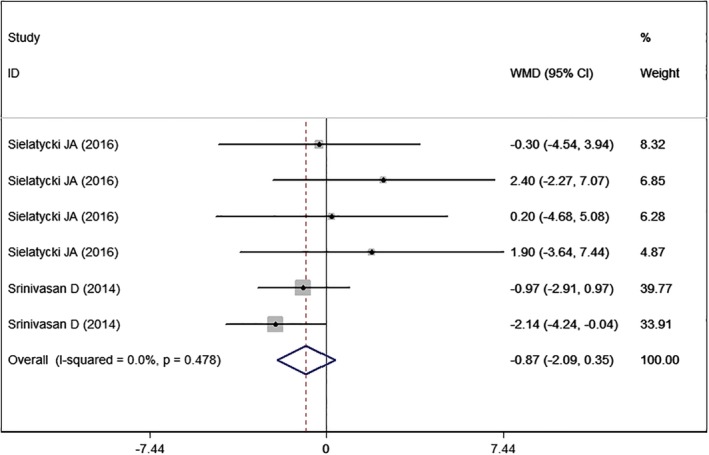
Forest plot showing the effect of high BMI on SF‐36 MCS.