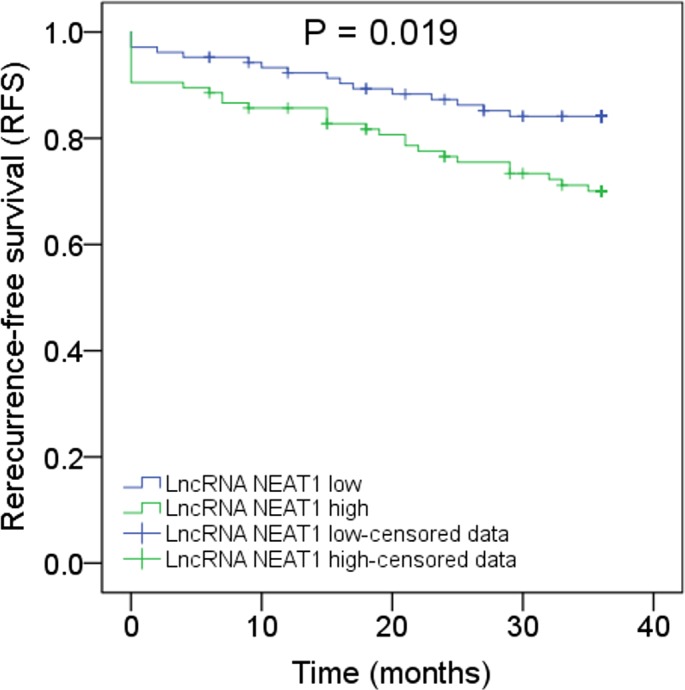
Figure 4.

Correlation of lncRNA NEAT1 expression with RFS. Analysis of RFS in lncRNA NEAT1 high expression patients and lncRNA NEAT1 low expression patients. K‐M curves were used to display the RFS. Comparison between two groups was determined by log‐rank test. LncRNA NEAT1, long noncoding RNA nuclear enriched abundant transcript 1; RFS, recurrence‐free survival K‐M curves, Kaplan‐Meier curves. P < .05 was considered significant
