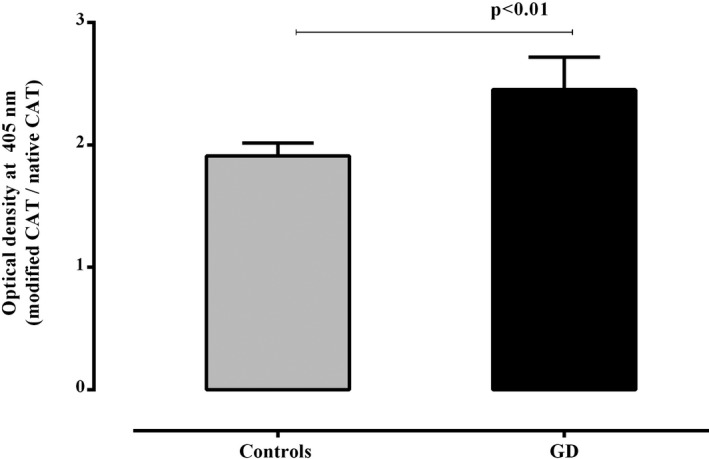
Figure 2.

Comparison of the ratio of reactivity to malondialdehyde‐modified catalase/reactivity to native catalase in patients with Graves' disease (GD) and controls. Data are presented as ratio of mean values of optical density at 405 nm (±SEM) of reactivities toward modified catalase and those toward the native one. Statistical analyses were performed using unpaired t test
