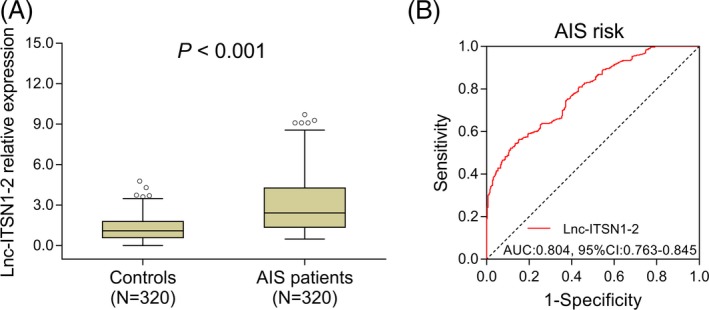
Figure 1.

Comparison of lnc‐ITSN1‐2 expression between AIS patients and controls. A, Comparison of lnc‐ITSN1‐2 expression between AIS patients and the controls. B, Predictive value of lnc‐ITSN1‐2 for AIS risk. Comparison between groups was performed by the Wilcoxon rank‐sum test. ROC curve was conducted, and AUC was calculated to evaluate the predictive value of lnc‐ITSN1‐2 for AIS risk. P value <.05 was considered significant. lnc‐ITSN1‐2, long non‐coding RNA intersectin 1‐2; AIS, acute ischemic stroke; ROC, receiver operating characteristic; AUC, area under the curve; CI, confidence interval
