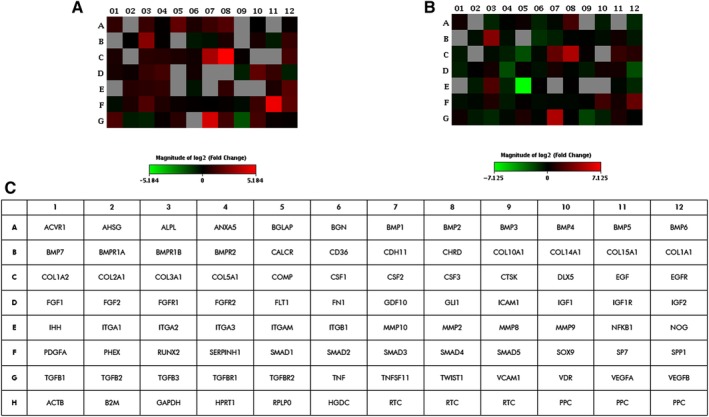
Figure 2.

Graphical representation through heat map of the mRNA expression in human adipose mesenchymal stem cells (hASCs) grown on Coll/Pro Osteon 200. The fold‐change values of upregulated (red) and downregulated (green) genes in hASCs grown on Coll/Pro Osteon 200 compared with the control are reported at day 21 (A) and day 40 (B), respectively. C, Plate scheme of RT2 osteogenic array
