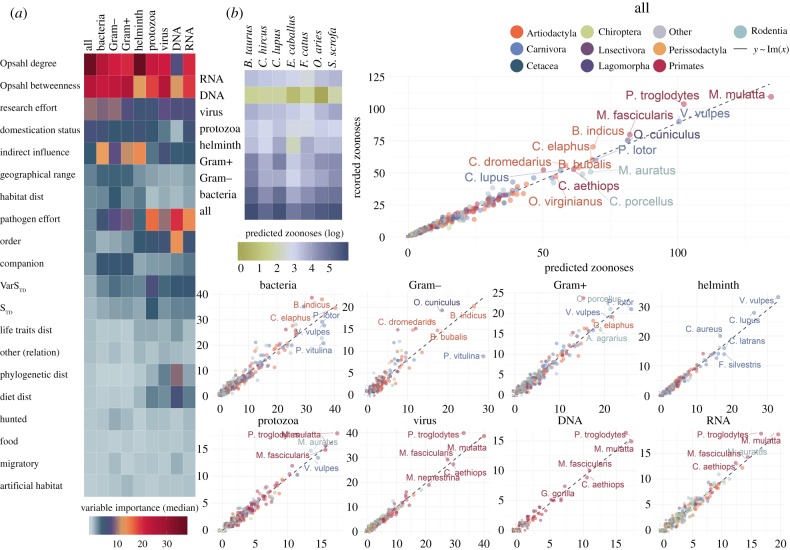
Figure 3.
Results of our ensemble models to explain the number of zoonoses harboured by mammalian species. (a) Median variable importance (relative influence) of predictors included in the models over 100 runs. For the purposes of this figure, the contribution of order predictors is summed. Details of contribution of all predictors over the 100 runs of each model are presented in electronic supplementary material, note S6 and figure S12. (b) Predicted number of zoonoses in each mammalian host species. Heat-map illustrates logged predicted number of zoonoses in livestock, horses and domesticated dogs and cats. Points represent mammalian species, coloured by their order, size = log (predicted zoonoses + 1). x-axes are predicted number of zoonoses; y-axes are detected number of zoonoses. Labels are top species by number of predicted zoonoses (n = 10 in all pathogens panel, n = 5 in other panels). (Online version in colour.)

