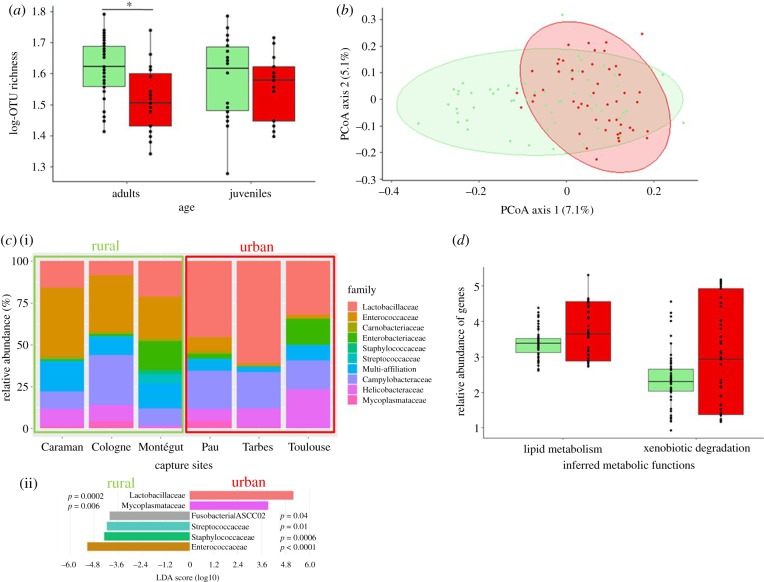
Figure 1.
(a) Bacterial species richness (log of OTU richness) of free-ranging house sparrows according to urbanization and bird age. (b) PCoA ordination based on a presence–absence similarity matrix of the gut microbiota of free-ranging house sparrows according to the urbanization ratio of the capture site. Numbers in parenthesis refer to the variance explained by the ordination axis. Coloured circles refer to 95% CI ellipses. (c)(i) Gut taxonomic composition (family level) of free-ranging house sparrows according to urbanization and capture site. (ii) Linear discriminant analysis (LDA) effect sizes representing the six families that most significantly differ in abundance between rural and urban populations at capture (see electronic supplementary material, figure S4 for full results). (d) Relative abundance of genes involved in two inferred metabolic functions according to urbanization. For all figures, median represented by the black line, 25 and 75% quartiles by the lower and upper box and 90% confidence interval by the whiskers. Red colour represents birds of urban origin and green rural origin. (Online version in colour.)

