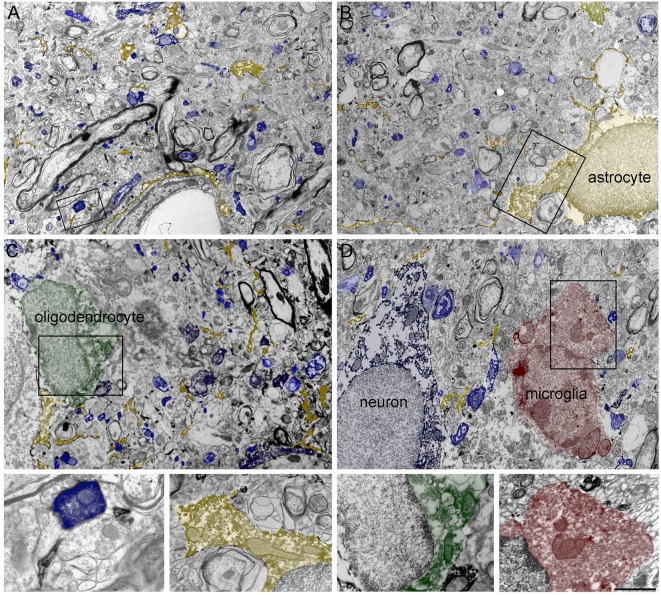
Figure 2.
(A–D) Four low-magnification electron microscopic (EM) fields showing GAT-1 immunoreactivity in cerebral neocortex (layers II–III of rat parietal cortex). Colored profiles code for different GAT-1-positive cell types and/or profiles: blue, axon terminals, axon, and neuron; yellow, astrocyte and astrocytic processes; green, oligodendrocyte; red, microglial cell. Framed regions in (A–D) are reproduced and enlarged, in the lowest portion of the figure. Bar: 2.5 μm for (A–D); 0.8 and 1 μm for enlarged frames of (A) and (B–D), respectively (modified from Melone et al., 2015; Fattorini et al., 2017, 2020).

