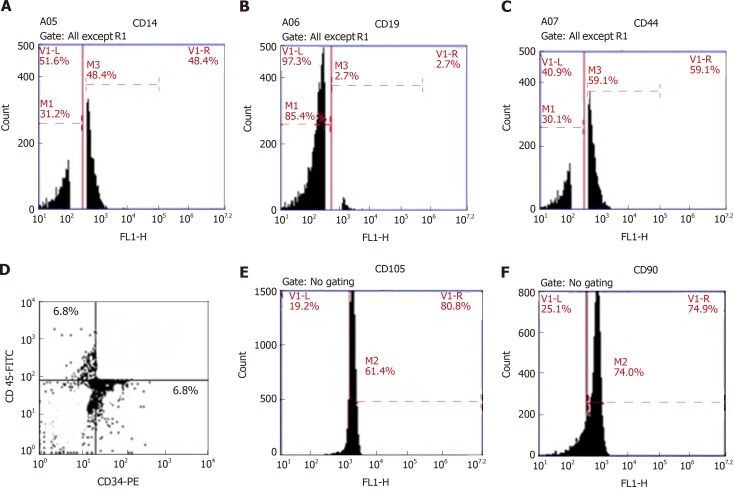
Figure 3.
Plots of the flow cytometric analysis of bone marrow-derived stem cells. A: anti-CD14; B: anti-CD19; C: anti-CD44; D: anti-CD34 (FL1-H) and anti-CD45 (FL2-H); E: anti-CD105; F: anti-CD90. A, B, C, E, and F are histograms of the relative fluorescence height (FL1-H) of surface markers against cell count, while D is a dot plot of the relative fluorescence height of the surface marker CD34-PE (FL1-H) against the relative fluorescence height of the surface marker CD45-FITC (FL2-H).

