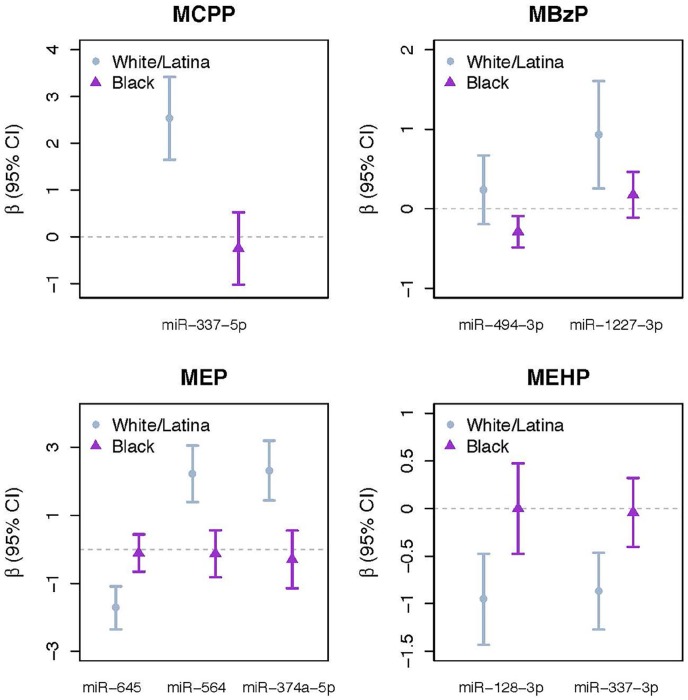
Figure 1.
Association between phthalate biomarkers and miRNAs in fibroid tissue with significant effect measure modification by race/ethnicity (FDR-adjusted q value < 0.10 for race/ethnicity × phthalate interaction term). Results are from models with an interaction term for phthalate biomarker and race/ethnicity, adjusted for age and BMI as well as including the main effects of phthalate biomarker (natural log-transformed, specific gravity-adjusted) and race/ethnicity. FDR q-values are adjusted for multiple testing for number of miRNAs but not for the number of phthalate biomarkers. Lower ΔCq signifies higher miRNA expression. BMI indicates body mass index; FDR, false discovery rate; miRNAs, microRNAs.

