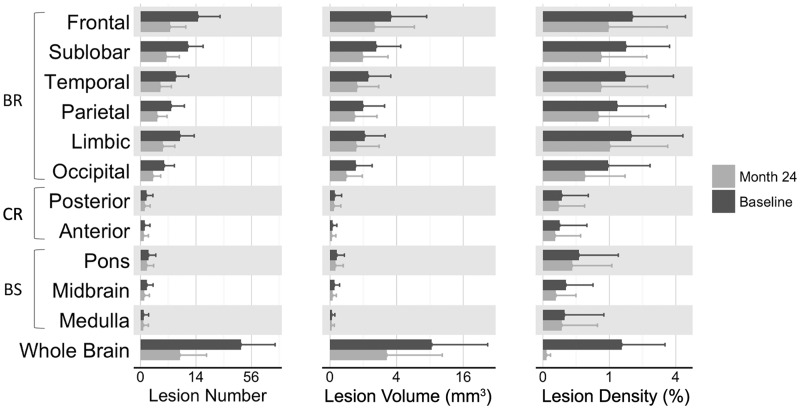
Figure 1.
Distribution of all T2 lesions at baseline (Baseline), and of new or enlarging lesions between baseline and month 24 (M24). Mean and standard deviation of lesion number, volume and density in each brain region and in the whole brain at baseline (i.e. pre-existing lesions at the study entry) and at M24 (i.e. new or enlarging lesions between baseline and M24). At baseline, mean and standard deviation were derived from the whole cohort, whereas at M24 only from placebo-treated patients to report the lesion formation in untreated patients. BR: supratentorial brain; BS: brainstem; CR: cerebellum.

