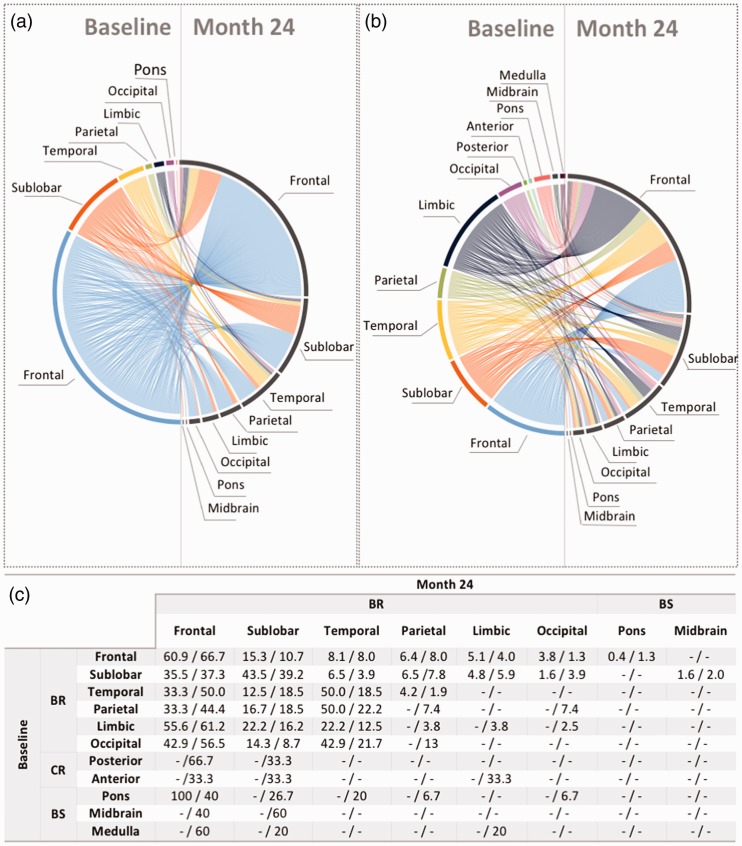
Figure 3.
The relationship between the regions with the highest number of lesions at baseline and the regions with the highest amount of NE lesions. To study the natural process of lesion formation in MS, the M24 analysis was performed on untreated (placebo) patients only. The left side of the circular plots represents the brain regions in which the patients had the highest number of lesions at baseline, whereas the right side represents the regions in which the patients developed the highest number of NE lesions during the 24 months of the trials. Each line represents a patient and connects the region where they had the highest number of lesions at baseline with the region in which they developed the highest number of new/enlarging lesions at M24. The circular plot in (a) used the LV to determine the highest amount, whereas the one in (b) used the lesion density. The table in (c) expresses the probabilities associated with the circular plots in (a) and (b) as LV/lesion density. Irrespective of the location of the highest number of lesions at baseline, the highest number of new lesions developed mostly in the frontal lobe, sublobar region and the temporal lobe. BR: supratentorial brain; BS: brainstem; CR: cerebellum; LV: lesion volume; M: month; NE: new/enlarging; MS: multiple sclerosis.

