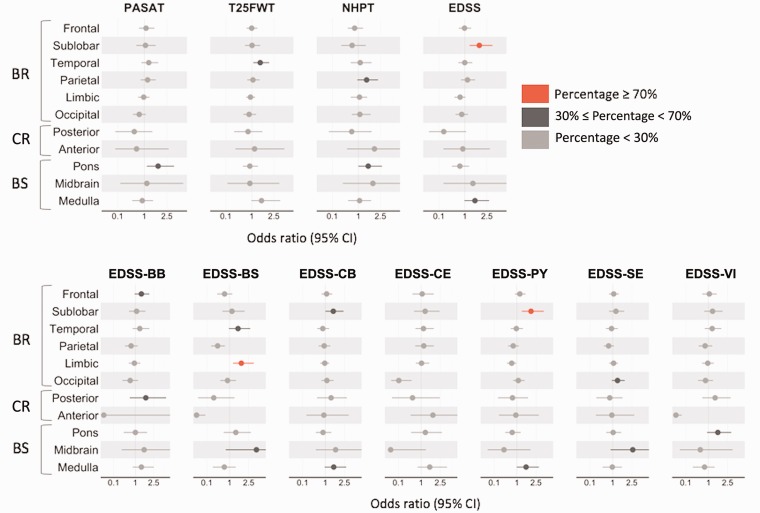
Figure 4.
Association between NE lesions in each region and the different disability worsening. The odds ratios and CIs plotted here were derived from the model defined as (4) using only the placebo-treated patients of the M24 dataset. The colour associated with each odds ratio and CI derived from the bootstrap analysis indicates the percentage of times in which the association between NE lesions in specific locations and disability worsening is stronger than the one between ‘average whole brain lesions’ and disability worsening: values are 0–100%, higher values indicate better reproducibility. A high NE lesion density in the sublobar region showed a stronger association with EDSS and EDSS-PY worsening than the association obtained using the NE lesion density defined in the whole brain. A stronger relationship was also found between NE lesion density in the limbic area and the EDSS-BS worsening. For the bootstrap analysis results, see Supplementary Table e-4. BR: supratentorial brain; BS: brainstem; CI: confidence interval; CR: cerebellum; EDSS: Expanded Disability Status Scale; EDSS-BB: EDSS bowel and bladder; EDSS-BS: EDSS brainstem; EDSS-CB: EDSS cerebellar; EDSS-CE: EDSS cerebral; EDSS-PY: EDSS pyramidal; EDSS-SE: EDSS sensory; EDSS-VI: EDSS visual; NE: new/enlarging; NHPT: 9-Hole Peg Test; PASAT: Paced Auditory Serial Addition Test; T25FWT: Timed 25-Foot Walk Test.

