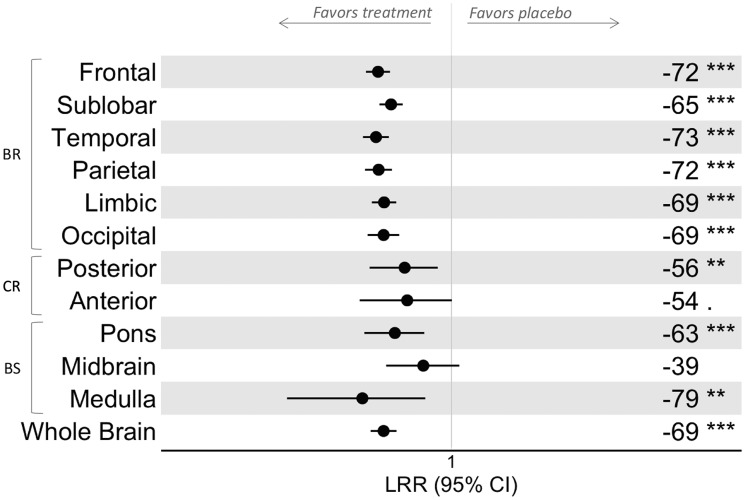
Figure 5.
Treatment effect of fingolimod 0.5 mg on the occurrence of NE lesions by location. In each brain region and in the whole brain, the effect of fingolimod on lesion formation was investigated using a negative binomial in which the new/enlarging lesion number was the dependent variable and treatment, clinical trial and baseline lesion number were the independent variables. The LRR between the fingolimod-treated and placebo patients was calculated, as were the CIs. The treatment effect of fingolimod versus placebo (% change) on the number of new or enlarging lesions was calculated as (LRR-1)*100 and is reported on the right side of the plot (a negative number favours fingolimod), together with the p value level (i.e. p > 0.1; . 0.1 ≤ p < 0.05; *0.05 ≤ p < 0.01; **0.01 ≤ p < 0.001; ***p ≤ 0.001). BR: supratentorial brain; BS: brainstem; CI: confidence interval; CR: cerebellum; LRR: lesion rate ratio; NE: new/enlarging.

